Several neurodegenerative diseases such as Alzheimer’s Disease (AD), Huntington’s Disease (HD), Parkinson’s Disease (PD), and Amyotrophic Lateral Sclerosis (ALS) as well as ischemic strokes all show signs of excess oxidative stress due to increased production of reactive oxygen species (ROS). The author here posits here that ascorbic acid (AA), commonly known as Vitamin C, can help prevent such neurodegenerative disorders. The author proposes a mathematical model that captures the biochemical dynamics between AA, dehydroascorbic acid (DHA), and ROS in the brain and performs simulations under control and neurodegenerative disease situations. Then, a variety of treatments using AA and DHA were proposed and simulated to examine their efficacy.
Although neurodegenerative diseases manifest themselves in different forms, in different people, with different symptoms and different biochemical mechanisms that lead to the diseased state, certain similarities have been identified. Behind most neurodegenerative diseases is an excess of oxidative stress; specifically, the source of this is an excess of ROS production that causes neuronal death and leads to common neurodegenerative symptoms such as memory loss.
Ascorbic acid in the neuron functions to scavenge the ROS generated as a function of neuronal metabolism and synaptic activation, preventing the neuron from reaching oxidative stress. However, in some neurodegenerative diseases, this balance can go awry, sometimes due to a lack of AA input, inefficient reduction of DHA to AA, or damaged SVCT2 or GLUT 1/3 receptors.
In this paper, we shall present and analyze a mathematical model capturing the dynamics among AA, DHA, and ROS within the central nervous system, and rigorously investigate the source of these neurodegenerative diseases.
2. Biochemical background
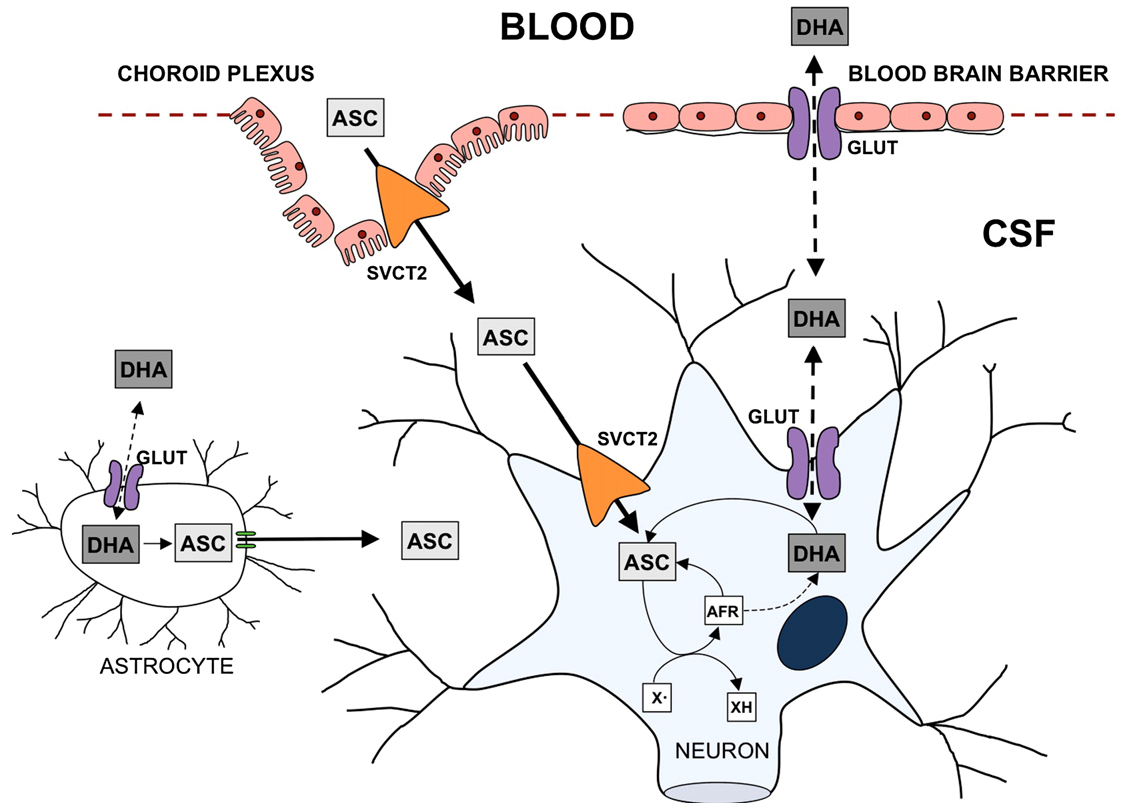
To mathematically model the neurochemical interactions described above, one must first thoroughly understand the underlying biochemistry. Uptake of DHA and AA into the central nervous system occurs in two steps. First, they must be transported from the plasma into the cerebrospinal fluid (CSF), and then from the CSF into the neuron. Note that only biochemistry directly related to our modeling situation will be considered, for brevity and clarity.
2.1. DHA & AA into the CSF
The mechanisms for DHA and AA entering the CSF are different. For DHA to enter the CSF, it must be taken up by the endothelial cells in the blood-brain barrier (BBB). Then, it may pass into the CSF through the GLUT 1/3 receptors.
AA’s journey begins by being taken up by the epithelium of the choroid plexus. It then may enter the CSF by passing through the SVCT2 receptors on the apical membrane of the choroid plexus.
2.2. DHA & AA into the Neuron
The transport of AA into the neuron occurs through passage via SVCT2 receptors on the receptor. The DHA in the CSF may be transported into the neuron via GLUT 1/3 receptors, as before. However, since DHA is toxic to the cell, it must undergo rapid intracellular reduction to AA.
2.3. ROS production
In the absence of synaptic activity, the AA in the neuron will be stored. However, during synaptic activity when ROS is produced, AA is oxidized to DHA, which then exits the cell (through the same GLUT 1/3 receptors as the DHA that entered). In this process, ROS is scavenged.
Another way for ROS to be scavenged is through the superoxide dismutases (SODs) which convert the ROS to hydrogen peroxide and water.
2.4. AA recycling
The DHA that is now in the extracellular space may then be recycled into AA for the neurons to use with astrocytes, types of glial cells. However, note that there are only GLUT 1 receptors on the astrocyte cells, so DHA uptake is significantly slower [1]. Then, DHA is reduced to AA inside the astrocyte, before the AA is released back into the extracellular space through glutamate induced cell swelling [2]Pinto}. This “recycled” AA can then be used again by the neurons. Evidence has been provided that, during synaptic activity, there is increased SVCT2 expression on the neuron [3, 4, 5, 6].
The biochemical flow chart in Figure 1 by [7]Harrison} concisely captures the above descriptions.
Figure 1. Transport of AA and DHA through the Brain.
Model creation
From the above biochemical framework, the following mathematical model was constructed:
Here, \(A_p\) and \(D_p\) represent the AA in the plasma (choroid plexus) and DHA in the plasma (blood-brain barrier), respectively. \(A_c\) and \(D_c\) are the AA and DHA in the CSF. \(A_n\), \(D_n\), and \(R_n\) are the AA, DHA, and ROS in the neuron. \(A_a\) and \(D_a\) are the AA and DHA in the astrocyte. \newline Brief descriptions of these equations are provided below:
3.1. Equation for Choroid Plexus AA (1)
The amount of AA in the choroid plexus is derived from an input term, from which some of the AA leaves to the CSF, and some of it undergoes natural degradation.
3.2. Equation for Blood Brain Barrier DHA (2)
The DHA in the blood brain barrier, like the AA in the choroid plexus, comes from an input term. The second term represents the amount of DHA that leaves to the CSF, and the last term is the natural degradation.
3.3. Equation for CSF AA (3)
The AA in the CSF comes from the choroid plexus as well as the astrocyte. Some of this AA leaves to the neuron, and some of it is degraded naturally.
3.4. Equation for CSF DHA (4)
The CSF DHA comes from the blood brain barrier, the neuron, and the astrocyte. It then leaves to the neuron and astrocyte, while also undergoing natural degradation.
3.5. Equation for Neuronal AA (5)
The neuronal AA comes from the CSF and the DHA in the neuron. Some of this leaves to the neuron (DHA), and some is degraded naturally.
3.6. Equation for Neuronal DHA (6)
DHA in the neuron comes from the CSF and the AA in the neuron. Some of this leaves to the AA in the neuron, some to the DHA in the CSF, and some is naturally degraded.
3.7. Equation for Neuronal ROS (7)
The first term here represents the ROS production term, the second term is the reduction in ROS due to neuronal AA sequestration through oxidation to DHA. The last term is natural degradation.
3.8. Equation for Astrocyte AA (8)
Astrocyte AA comes from astrocyte DHA. There is an output term to the CSF AA, and a term for natural degradation.
3.9. Equation for Astrocyte DHA (9)
The first term is the input term for astrocyte DHA from the DHA in the CSF. The second term is the output to astrocyte AA. The next term is the output to CSF DHA, and the last term is natural degradation.
4. Parameter Estimation
Table 1 represents the base values of the parameters used in creating simulations of the dynamics among ascorbic acid, dehydroascorbic acid, and reactive oxygen species in the brain.
The ODE model created was simulated under various conditions; both basic plots and phase plane plots were created (plotting ROS production against AA concentration in the neuron). All of the below simulations below were run using just one pulse of external (plasma) AA and DHA input. Moreover, since there exists a natural degradation of these chemicals, their concentrations will eventually tend to 0.
ROS, on the other hand is continually produced in the presence of synaptic activity (which was assumed to be continuous), and is assumed to have no degradation (needs to be scavenged by AA). Thus, for the following cases, primarily short-term behavior will primarily be considered.
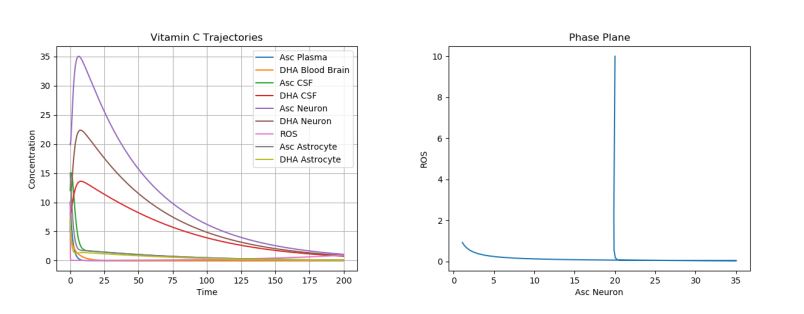
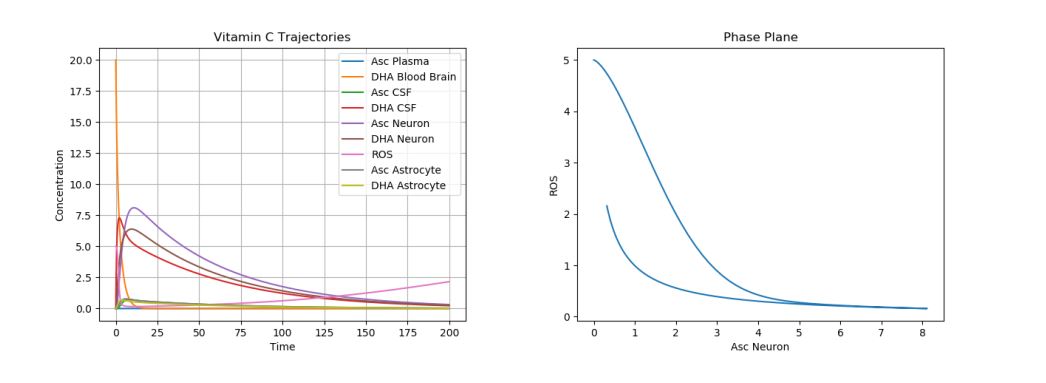
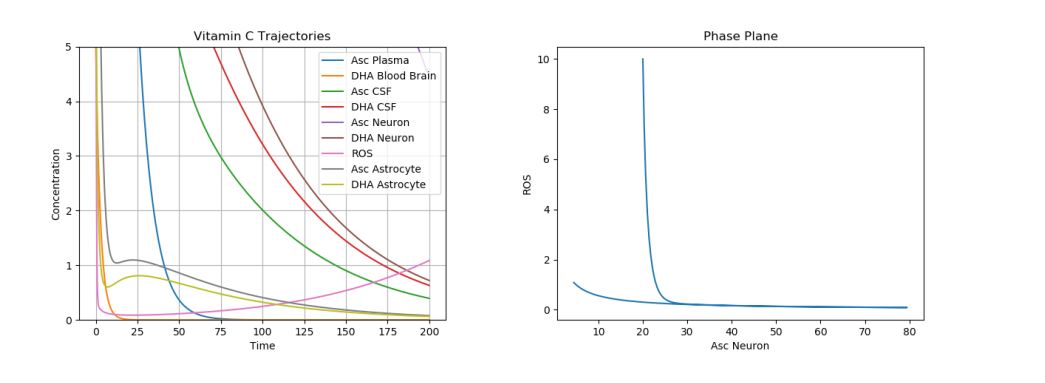
The first simulation was performed using the default parameter values above. The following physiologically plausible initial values were used: \(A_p\)=10, \(D_p\)=5, \(A_c\)=12, \(D_c\)=8, \(A_n\)=20, \(D_n\)=5, \(R_n\)=10, \(A_a\)=15, and \(D_a\)=7. The results can be seen in Figure 2.
Figure 2. Dynamics of AA, DHA, and ROS in a Control Case.
This is our “control case”. Note that these results are in accordance with physiological results. Due to the degradation of AA and DHA in the brain, one can see the ROS production slowly increase at the end of the time period, when all the AA and DHA concentrations are nearing 0. Moreover, one can see that the DHA and AA in the plasma almost immediately drop to 0 as their AA and DHA are transported to the CSF. Then, one can see that the AA and DHA in the CSF decrease faster next, and the AA and DHA in the neurons decay slowest. This is in accordance with the normal physiological observations, which show the most AA concentrated in the neuron, then in the CSF, and lastly in the plasma surrounding the brain. Now, we shall consider the different cases of neurological disorders.
6. Neurological disorder simulations
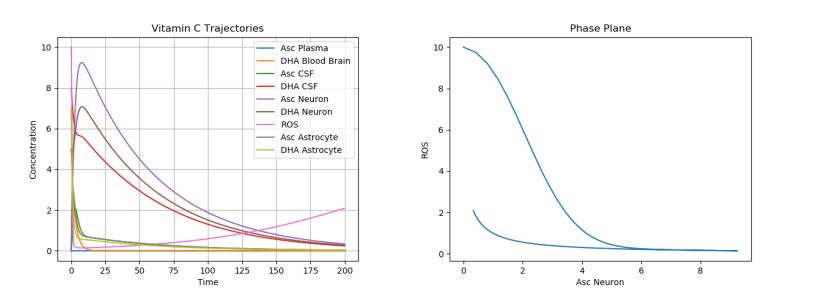
6.1. Cerebral ischemia
One of the most dramatic oxidative stresses of the CNS occurs during the ischemia-reperfusion injury due to an ischemic stroke. Here, the ischemia initially greatly depletes ascorbate in the brain [15]. If reperfusion with oxygen rich blood occurs, the ROS generated as a product will cause tissue damage [13]. This stroke can be modeled by setting all ascorbic acid initial values to 0 while leaving the other initial conditions the same. A simulation of this phenomenon can be seen in Figure 3.
Figure 3. Dynamics of AA, DHA, and ROS during a Stroke.
There are a few important things to note here. One is that, the overall trends of AA, DHA, and ROS concentrations do not change much. This is due to the fact that an ischemic stroke simply introduces a severe perturbation into the system, without changing the underlying dynamics, i.e., the stroke depletes all ascorbic acid in the brain (changing the initial conditions of the system), but does not change any parameter values.
As a result, as can be seen in the plot, the only long-term damage that would be noticed is due to the tissue damage, a result of the increased ROS production. Experimentally, it has been shown that, in mice suffering from middle cerebral artery occlusion, high dose DHA given by intra-luminal infusion injection markedly decreased infarct volume, mortality, and neurological deficits in mice [16].
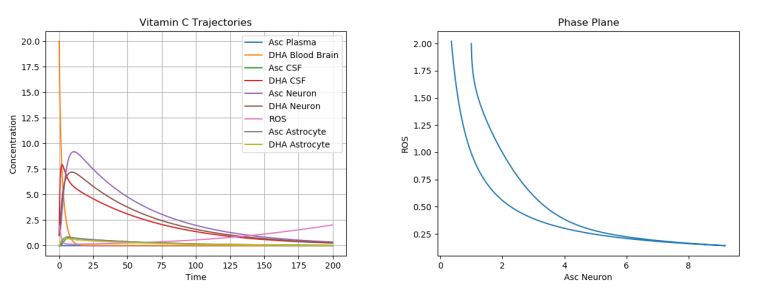
Figure 4. Dynamics of AA, DHA, and ROS during Stroke with High Dose DHA Treatment.
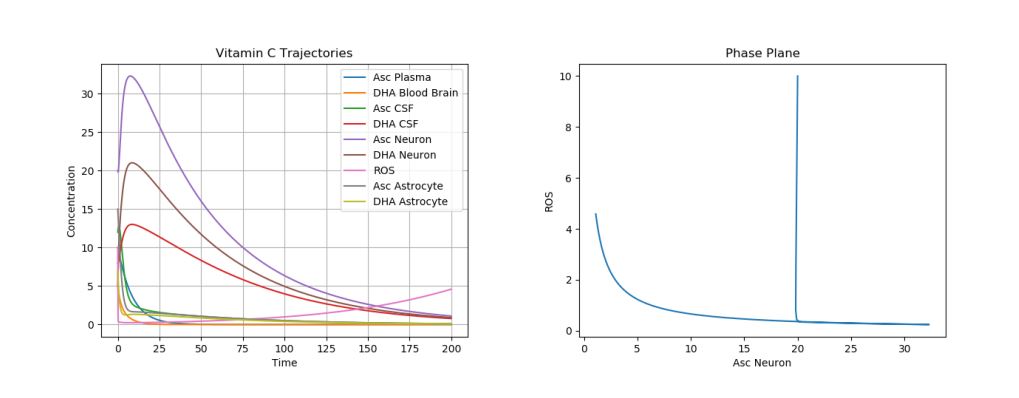
These observations can be observed in our model. Starting with the values observed at the end of the stroke simulations (\(A_n\)=\(D_n\)=\(D_c\)=1, \(R_n\)=2), we can simulate this treatment by setting \(D_p\) to 20. The results of this treatment can be visualized in Figure 4.
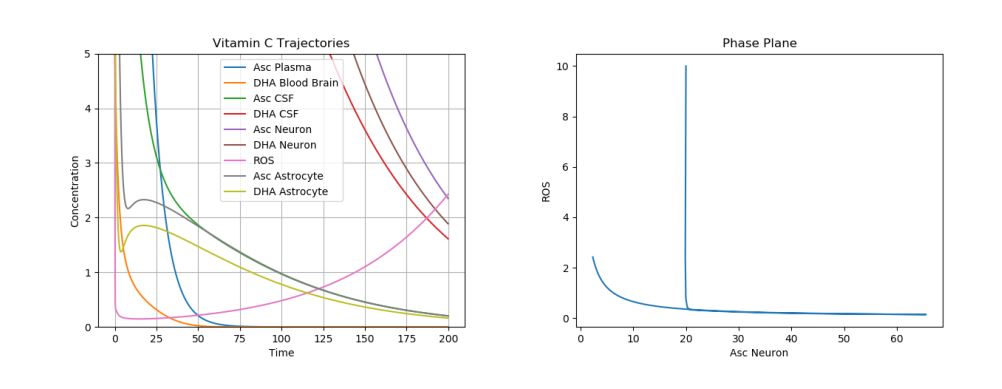
It has, perhaps surprisingly, been experimentally shown that similar suppression of ROS production and tissue damage was observed regardless of the time of the treatment (treatments were given just before induced stroke, 15 minutes after, and 3 hours later) [16]. This is also supported by our model observations. Simulations were run with \(R_n\)=5, \(D_p\)=20, and all else set to 0, and very similar results were observed (Figure5).
Figure 5. Dynamics of AA, DHA, and ROS during Stroke with Delayed High Dose DHA Treatment.
However, as can be seen in Figure 6, if no treatment (or not enough) was given, ROS production shoots up rapidly, eventually leading to brain death:
Figure 6. Dynamics of AA, DHA, and ROS during Stroke with not Enough Treatment.
As mentioned by the medical experimenters in [16], the downside of using such a therapy is that DHA is toxic to the brain tissue itself; however, they presumed that the benefits of such a treatment outweigh the costs.
6.2. Alzheimer’s Disease
AD is another neurological disorder in which oxidative stress plays a key role in the pathogenesis of the disease [17, 18]. Specifically, it has been noted that AD patients have low plasma [19] and CSF [20] ascorbate levels, despite adequate nutritional intake.
Another neuropathalogical change that occurs with AD onset is the presence of neurofibrillary tangles composed of \(\beta\)-amyloid deposits that accumulate in the cytosol and extracellular senile plaques [2]. The presence of these tangles increases neuron vulnerability to oxidative stress, while also impairing the electron transition chain [21]. Moreover, studies have shown that the A\(\beta\) aggregation promotes ROS production [22]. These dynamics are captured in our q parameter, the coefficient dealing solely with ROS production.
To model this, one must actually change the parameter values describing the plasma intake (p), CSF intake (c), and ROS production (q), leaving the initial conditions the same. Figure 7 simulates AD by using the default initial conditions and parameter values while changing \(p\) to 0.05, \(c\) to 0.15, and \(q\) to 5.
Figure 7. Dynamics of AA, DHA, and ROS in AD.
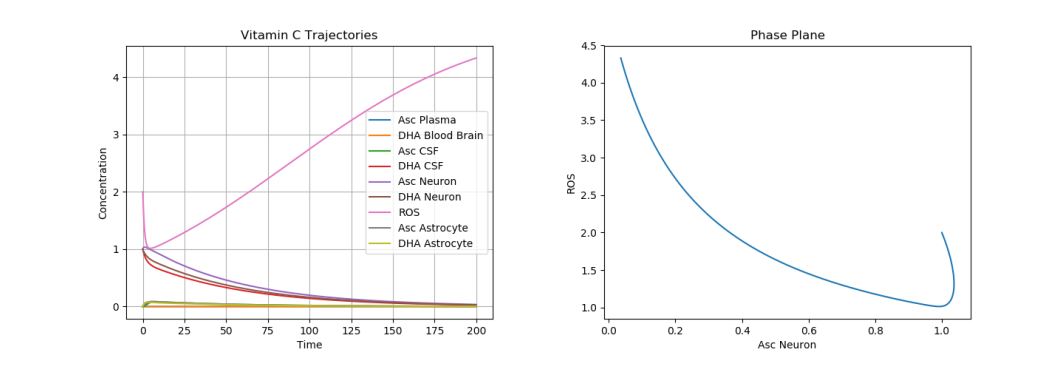
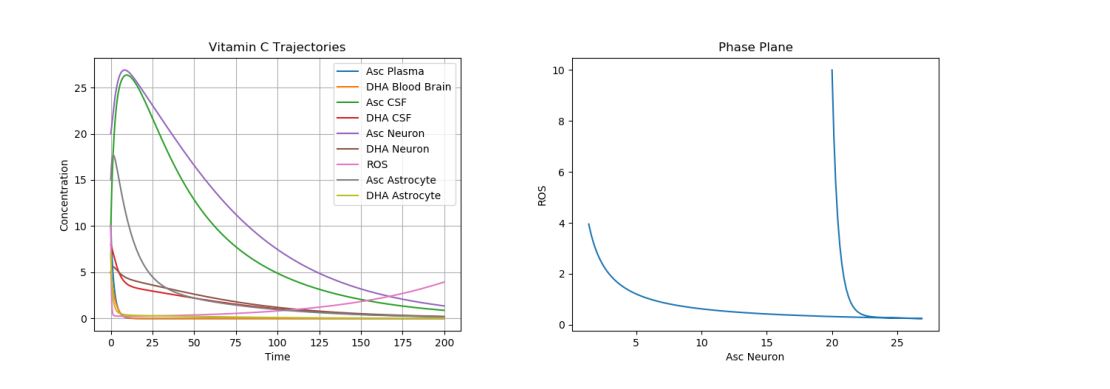
As expected, we see greatly increased ROS production. This cannot be simply solved (as with the ischemic stroke) with a few AA intakes. It must instead be dealt with consistently, since AD modifies the actual parameters of the system. There are several ways to do this. Proposed therapeutic solutions include increased oral AA intake to compensate for poor uptake mechanisms in the plasma and choroid plexus [23, 24, 25]; however, such solutions have not always been shown to help in AD patients, due to the great variability in patients with respect to education and career, diet, exercise, alcohol consumption, smoking, and general health [7]. This can be simulated in Figure 8 with our model by increasing the initial \(A_p\) to 100. This plot is zoomed in to more accurately see ROS production.
Figure 8. Dynamics of AA, DHA, and ROS in AD with AA Treatment.
As can be seen, this brought the AA production temporarily. However, as can be seen by the phase plane, this is no permanent fix, as the ROS production will ramp up given enough AA degradation. Thus, such AA intakes must be given relatively regularly (how regular depending on the other variables mentioned above).
Another, mathematically plausible but medically short-sighted treatment would be to reduce synaptic activity. This is simulated in Figure 9 by letting \(\alpha\)=0.2 (reduced by 5 times).
Figure 9. Dynamics of AA, DHA, and ROS in AD with Reduced Synaptic Activity.
As can be seen here, by doing this, the AD returns to somewhat normal dynamics. However, it was assessed that the costs of this outweigh the benefits, though this may still be used as a temporary treatment (physicians may reduce brain activity or neural simulation of an AD patient, without putting him/her in a total coma. This would allow the AA, DHA, and ROS concentration to return to relatively normal dynamics).
6.3. Huntington’s Disease
During HD, impaired SOD activity has been observed [26]; this reduces the “natural death rate”, \(d_r\), in our model. Abnormal AA release from astrocytes (s) and impaired AA uptake in neurons (f) were noticed in [27]. So, simulations of our model were run by setting \(d_r\) to 0.02, s to 0.1, and f to 0.1. The results can be seen in Figure 10.
Figure 10. Dynamics of AA, DHA, and ROS in HD.
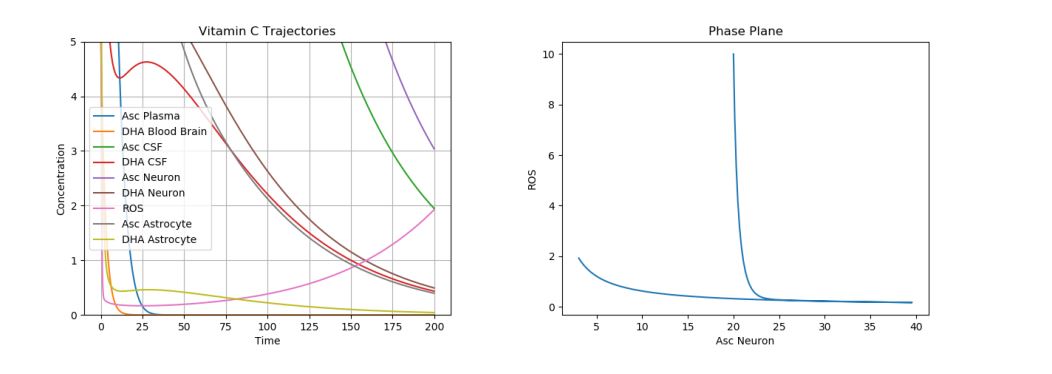
As one can see, there is an increase in ROS production and thus oxidative stress in HD patients, as expected. Treatments for HD primarily revolve around AA injections. In Figure 11, like was done for the AD case, the initial \(A_p\) was increased to 100, with promising results. The plot below is zoomed in again, to reflect the change in ROS production over time.
Figure 11. Dynamics of AA, DHA, and ROS in HD with AA Treatment.
As can be seen, the ROS production significantly dropped by \(t=200.\) One must note again, as in AD, this is just a temporary fix because, as can be seen in the phase plane analysis, the treatment is just delaying high ROS levels by keeping neuronal AA high.
7. Conclusion
In this paper, a mathematical model analyzing dynamics among AA, DHA, and ROS production in the brain has been considered. The model was also examined under various neurodegenerative diseases and was shown to be consistent with medical findings. Specifically, it was shown that giving high dose DHA to patients suffering from middle cerebral artery occlusion suppressed ROS production, thus tempering neurological damage, a phenomenon which occurs regardless of the time of treatment. Short term solutions from AA treatments were found for AD and HD, but these treatments only temporarily reduced ROS production. The author hopes this work will inspire future medical research into the use of AA and DHA as treatments for a variety of neurological disorders.
8. Appendix
8.1. Michaelis-Menten Kinetics Computation
Provided here is an explanation of how the diffusion parameter constants were estimated. Specifically, data was found for AA, but not DHA. Thus, explicit computations were performed from AA, and the DHA parameters were scaled appropriately.
The Michaelis-Menten model is one of enzyme kinetics, relating reaction rate to substrate concentration to give one parameter describing rates of enzymatic reaction. This was used in our case to determine the rate at which AA passes through SVCT2 transporters. The Michaelis-Menten equation is as follows:
where [P] is the product concentration, [S] is the substrate concentration, \(V_{max}\) is the maximum rate achieved by the system at saturating substrate concentration, and \(K_M\) is the substrate concentration at which the reaction rate is half of \(V_{max}\).
From [28], the data shown in Table 2 was obtained:
Table 2. \(V_{max}\) and \(K_M\) Estimations for Brain and CP.
Brain
Choroid Plexus (CP)
\(V_{max}\)
1.2
29.7
\(K_M\)
125
44
The substrate concentration was set to 58 \(\mu M\), the accepted physiological level [28]. Then, after substituting these values into the Michaelis-Menten equation (10), the \(V_{brain}\) was approximately 0.72, whereas the \(V_{CP}\) was approximately 0.15.
Since it’s known that DHA enters the CSF significantly faster than AA enter the CSF, for the blood brain barrier, we let \(V_{BBB}\) be 0.25, and the other GLUT channels be 0.72, as with the AA [2].
However, in the astrocytes, since there are only GLUT 1 channels, the DHA uptake rate will be slower. Since it has been experimentally determined that the GLUT 3 expression is generally ~6 times more than GLUT 1, the \(V_{astro}\) was set to 0.1 [1].
Author Contributions
All authors contributed equally to the writing of this paper. All authors read and approved the final manuscript.
Competing Interests
The author(s) do not have any competing interests in the manuscript.
References
Maher, F., & Simpson, I. A. (1994). The GLUT3 glucose transporter is the predominant isoform in primary cultured neurons: assessment by biosynthetic and photoaffinity labelling. Biochemical Journal, 301(2), 379-384. [Google Scholor]
Covarrubias-Pinto, A., Acuña, A. I., Beltrán, F. A., Torres-Díaz, L., & Castro, M. A. (2015). Old things new view: ascorbic acid protects the brain in neurodegenerative disorders. International journal of molecular sciences, 16(12), 28194-28217. [Google Scholor]
Basse-Tomusk, A., & Rebec, G. V. (1991). Regional distribution of ascorbate and 3, 4-dihydroxyphenylacetic acid (DOPAC) in rat striatum. Brain research, 538(1), 29-35. [Google Scholor]
Boutelle, M. G., Svensson, L., & Fillenz, M. (1989). Rapid changes in striatal ascorbate in response to tail-pinch monitored by constant potential voltammetry. Neuroscience, 30(1), 11-17. [Google Scholor]
Ghasemzedah, B., Cammack, J., & Adams, R. N. (1991). Dynamic changes in extracellular fluid ascorbic acid monitored by in vivo electrochemistry. Brain research, 547(1), 150-154. [Google Scholor]
O’Neill, R. D., Fillenz, M., Sundstrom, L., & Rawlins, J. N. P. (1984). Voltammetrically monitored brain ascorbate as an index of excitatory amino acid release in the unrestrained rat. Neuroscience letters, 52(3), 227-233. [Google Scholor]
Harrison, F. E., & May, J. M. (2009). Vitamin C function in the brain: vital role of the ascorbate transporter SVCT2. Free Radical Biology and Medicine, 46(6), 719-730. [Google Scholor]
Rice, M. E. (2000). Ascorbate regulation and its neuroprotective role in the brain. Trends in neurosciences, 23(5), 209-216. [Google Scholor]
Fukumura, H., Sato, M., Kezuka, K., Sato, I., Feng, X., Okumura, S., … & Saito, T. (2012). Effect of ascorbic acid on reactive oxygen species production in chemotherapy and hyperthermia in prostate cancer cells. The Journal of Physiological Sciences, 62(3), 251-257.
[Google Scholor]
Stamford, J. A., Kruk, Z. L., & Millar, J. (1984). Regional differences in extracellular ascorbic acid levels in the rat brain determined by high speed cyclic voltammetry. Brain research, 299(2), 289-295. [Google Scholor]
Schenk, J. O., Miller, E., Gaddis, R., & Adams, R. N. (1982). Homeostatic control of ascorbate concentration in CNS extracellular fluid. Brain research, 253(1-2), 353-356. [Google Scholor]
Castro, M. A., Beltrán, F. A., Brauchi, S., & Concha, I. I. (2009). A metabolic switch in brain: glucose and lactate metabolism modulation by ascorbic acid. Journal of neurochemistry, 110(2), 423-440. [Google Scholor]
Rice, M. E., Lee, E. J., & Choy, Y. (1995). High levels of ascorbic acid, not glutathione, in the CNS of anoxia-tolerant reptiles contrasted with levels in anoxia-intolerant species. Journal of neurochemistry, 64(4), 1790-1799. [Google Scholor]
Rice, M. E., & Russo-Menna, I. (1997). Differential compartmentalization of brain ascorbate and glutathione between neurons and glia. Neuroscience, 82(4), 1213-1223.[Google Scholor]
Flamm, E. S., Demopoulos, H. B., Seligman, M. L., Poser, R. G., & Ransohoff, J. (1978). Free radicals in cerebral ischemia. Stroke, 9(5), 445-447. [Google Scholor]
Huang, J., Agus, D. B., Winfree, C. J., Kiss, S., Mack, W. J., McTaggart, R. A., … & Fox, W. D. (2001). Dehydroascorbic acid, a blood-brain barrier transportable form of vitamin C, mediates potent cerebroprotection in experimental stroke. Proceedings of the National Academy of Sciences, 98(20), 11720-11724. [Google Scholor]
Montine, T. J., Neely, M. D., Quinn, J. F., Beal, M. F., Markesbery, W. R., Roberts II, L. J., & Morrow, J. D. (2002). Lipid peroxidation in aging brain and Alzheimer’s disease. Free Radical Biology and Medicine, 33(5), 620-626. [Google Scholor]
Praticò, D. (2002). Alzheimer’s disease and oxygen radicals: new insights. Biochemical pharmacology, 63(4), 563-567.[Google Scholor]
Riviere, S., Birlouez-Aragon, I., Nourhashemi, F., & Vellas, B. (1998). Low plasma vitamin C in Alzheimer patients despite an adequate diet. International journal of geriatric psychiatry, 13(11), 749-754. [Google Scholor]
Schippling, S., Kontush, A., Arlt, S., Buhmann, C., Sterenburg, H. J., Mann, U., … & Beisiegel, U. (2000). Increased lipoprotein oxidation in Alzheimer’s disease. Free Radical Biology and Medicine, 28(3), 351-360. [Google Scholor]
Wenk, G. L. (2003). Neuropathologic changes in Alzheimer’s disease. Journal of Clinical Psychiatry, 64, 7-10. [Google Scholor]
Bush, A. I., Masters, C. L., & Tanzi, R. E. (2003). Copper, B-amyloid, and Alzheimer’s disease: tapping a sensitive connection. Proceedings of the National Academy of Sciences, 100(20), 11193-11194.[Google Scholor]
Engelhart, M. J., Geerlings, M. I., Ruitenberg, A., van Swieten, J. C., Hofman, A., Witteman, J. C., & Breteler, M. M. (2002). Dietary intake of antioxidants and risk of Alzheimer disease. Jama, 287(24), 3223-3229. [Google Scholor]
Morris, M. C., Beckett, L. A., Scherr, P. A., Hebert, L., Bennett, D. A., Field, T. S., & Evans, D. A. (1998). Vitamin E and vitamin C supplement use and risk of incident Alzheimer disease. Alzheimer disease and associated disorders,12, 121-126. [Google Scholor]
Rosales-Corral, S., Tan, D. X., Reiter, R. J., Valdivia-Velazquez, M., Martinez-Barboza, G., Pablo Acosta-Martinez, J., & Ortiz, G. G. (2003). Orally administered melatonin reduces oxidative stress and proinflammatory cytokines induced by amyloid-\(\beta\) peptide in rat brain: a comparative, in vivo study versus vitamin C and E. Journal of Pineal Research, 35(2), 80-84.[Google Scholor]
Pastore, P., Rizzetto, T., Curcuruto, O., Cin, M. D., Zaramella, A., & Marton, D. (2001). Characterization of dehydroascorbic acid solutions by liquid chromatography/mass spectrometry. Rapid Communications in Mass Spectrometry, 15(22), 2051-2057.[Google Scholor]
Acuña, A. I., Esparza, M., Kramm, C., Beltrán, F. A., Parra, A. V., Cepeda, C., … & Brauchi, S. (2013). A failure in energy metabolism and antioxidant uptake precede symptoms of Huntington’s disease in mice. Nature communications, 4, 2917. [Google Scholor]
Lam, D.K, & Daniel, P.M. (1986). The Influx of Ascorbic Acid Into the Rat’s Brain. Quarterly Journal of Experimental Physiology, 71, 483-489. [Google Scholor]