Engineering and Applied Science Letter
ISSN: 2617-9709 (Online) 2617-9695 (Print)
DOI: 10.30538/psrp-easl2021.0058
Variation of radiofrequency intensities from the DTTV-transmitter in Kampala Metropolitan; Uganda
Peter Opio\(^1\), Akisophel Kisolo, Willy Okullo, Tumps. W. Ireeta
Department of Physics, College of Natural Science, Makerere University, P.O Box 7062, Kampala, Uganda.; (P.O & A.K & W.O & T.W.I)
Abstract
Keywords:
1. Introduction
Transmission of television signals ever since the inception of television broadcast [1] has been on the Analogue Television (ATV) technology until a couple of years ago that Digital Terrestrial Television (DTTV) technology was proposed in a bid to maximize frequency spectrum and have good quality of television services [2]. With DTTV technology, television signals are transmitted by multiplex transmitters (transmission of many channels in a single frequency range) and are being radiated from the transmitting antenna whereas in ATV technology, the signals are transmitted through a single channel by an analogue transmitter [3]. Reception of DTTV signals is always influenced by a number of factors like; the height of transmitting and receiving antenna's, the output power of the transmitter [4], the terrain between the transmitter and the receiver, the effect of meteorological parameters [5] and foliage, amongst others.
All forms of radiation in free space are governed by the inverse square law. For this law, if the distance from the transmitter is doubled, the power density of the radiated wave is reduced to a quarter of its former value at the new location. Power density is the radiated power per unit area, hence a measure of radiofrequency intensity and received signal strength. In radiation, power density is directly proportional to the transmitted power and is inversely proportional to the square of the distance from the source [6,7,8]. Therefore;
Globally, almost all countries have switched onto DTTV in accordance with the dates of 17 June 2015 (for Ultra High Frequency) and 17 June 2020 (for Very High Frequency) as set by ITU [9] for its member states, including Uganda.
Uganda being in ITU region 1, her DTTV broadcasting service has a primary allocation of 470-790 MHz frequency band and the Digital Switch Over (DSO) was done on June 2015, within 60 Km radius of Kampala Metropolitan [10].
The motivation for this research was because Kampala Metropolitan, Uganda, was the first region to undergo full DSO and as a result, there was need to know the quality of service, the propagation pattern and coverage of DTTV signals with distance from the transmitter at various climatic zones.
Radiofrequency intensity is a measure of the DTTV received signal (received power). The higher the value of RF intensity, the higher is the received power from the DTTV transmitter and the better is the quality of the received TV signal. The purpose of this work is to study the variation of radiofrequency intensity for different distances from the transmitter. Related studies by different researchers from different countries (Nigeria, Korea, India, and Spain) have been carried out as explained by [11,12,13,14]. In these studies, the quality of DTTV signals reception at different distances and locations have been analyzed.
In Uganda, since little is known about radiofrequency intensities from DTTV transmitter and their relation to TV signals reception, this study is important in order to give a clear sense about the DTTV situation. With this study, we will be able to know the signal attenuation in DTTV transmission. In ATV technology, signal attenuation may not lead into total loss of the signal, which is not the case with DTTV technology. In DTTV technology, TV reception levels below \(-116 dBm\), will lead to total loss of signals [13,15,16].
2. Materials and methods
In order to investigate the variation of radiofrequency intensities from the broadcasting transmitter in Kampala, measurements were done in an outdoor setting for a period of two months. The measurements first considered all the DTTV- UHF frequency band of \(470-862 MHz\) and there after a \(470-790 MHz\) frequency band as assigned to Uganda by the ITU [9] and as implemented by UCC [10] was selected.2.1. Measurement location
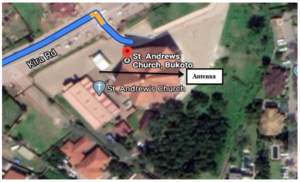
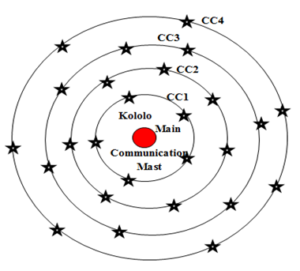
The two month measurements were conducted during day hours at seven different locations which were marked on different eight concentric circles, that's, CC1, CC2, CC3, CC4, CC5, CC6, CC7 and CC8. The radius of these concentric circles determined the horizontal distances between the measured points, that's receiver antenna and the transmitter. The radii of CC1, CC2, CC3, CC4, CC5, CC6, CC7 and CC8 were; 1 Km, 2 Km, 3 Km, 4 Km, 5 Km,6 Km,7 Km and 8 Km respectively, from the transmitter. A Google map of one of the measurement location at Latitude: 0.348340, Longitude: 32.599286 is shown in Figure 1.
Figure 1. One of the measurement locations
Each measurement location chosen in this research had at least the minimum achievable Direct Line of-Sight (DLoS) with the DTTV-Transmitter and the minimum distance of the receiving antenna from the ground. The locations are in urban setting hence allowing signal measurements which have encountered less distortion in form of; absorption, diffraction, reflection, refraction, scattering and directional characteristics of both the transmitter and the receiver antennas [17].
2.2. Measurement setup
The Setup measurement at every measurement location was made up of a calibrated Aaronia Spectran HF-6065V4 spectrum analyzer, an Aaronia AG HyperLOG 4025 Antenna, a \(T430s\) Lenovo Laptop, connected to the spectrum analyzer via a USB cable, and the MCS software. The MSC software is specifically designed to run on Aaronia spectrum analyzers and can easily suit a given measurement since it is easy to configure. Points on each concentric circle as shown in Figure 2, where randomly selected and determined the Measurement Locations (MLos).
Figure 2. View of the Measurement Locations (MLos) on the concentric circles
A full over view of the UHF frequency band of 470-862 MHz at different seven location measurements were taken. An average of two times measurements at every measurement location were taken for every 5 minutes for a period of 10 minutes before taking the actual average measurements of the frequency band variation of radiofrequency intensities. The radiofrequency intensity measurements were measured in form of Reference Signal Received Power (RSRP).
In Kampala Uganda, the DVB-Transmitter broadcasts all the television signals within the frequency range of \(470-790 MHz\), with the \((470-694) MHz\) as the sub \(700 MHz\) frequency band and \((694-790) MHz\) as the \(700 MHz\) frequency band.
The configurations of the parameters for the spectrum analyzer on the MCS software during the measurements are as in Table 1.
Table 1. Parameter configuration for the spectrum analyzer.
| \textbf{Parameter} | \textbf{Value} |
|---|---|
| UHF Frequency range | 470 MHz-862 MHz |
| DVB-T broadcasting band | Sub 700 MHz band |
| 700 MHz band | |
| Resolution Band Width | 100 KHz |
| Video Band Width | 100 KHz |
| Sweep time | 5ms |
| Detection type | RMS |
| Sample points | 100 |
| Attenuation factor | Auto |
| Reference level | -10 |
| Unit | dBm |
3. Results and discussion
Measurements of all the UHF frequency range for DTTV has been made for the eight concentric circles whose GPS coordinates for every measurement locations on each circle are as seen in Table 2.
Table 2. GPS coordinates for the different measurements location on the different concentric circles.
| Measurement Location (MLo) | \(\mathbf{GPS}\) (\mathbf{Coordinates}\) | \(\mathbf{CC1}\) | \(\mathbf{CC2}\) | \(\mathbf{CC3}\) | \(\mathbf{CC4}\) | \(\mathbf{CC5}\) | \(\mathbf{CC6}\) | \(\mathbf{CC7}\) | \(\mathbf{CC8}\) |
|---|---|---|---|---|---|---|---|---|---|
| 1 | Latitude | 0.3332 06 | 0.32894 99999 | 0.3299 1 | 0.32592 16666 | 0.3482 4833 | 0.3294 266 | 0.3309 2667 | 0.2689 25 |
| Longitude | 32.587 644 | 32.5830 11667 | 32.573 885 | 32.5654 5466 | 32.562 78166 | 32.552 29 | 32.545 64167 | 32.566 18 | |
| Altitude | 1203 | 1175 | 1201 | 1188 | 1173 | 1242 | 1271 | 1169 | |
| 2 | Latitude | 03272 016 | 0.31827 | 0.3384 85 | 031893 1666 | 0.3355 267 | 0.3382 5 | 0.2948 15 | 00.2728 |
| Longitude | 32.596 766 | 32.5903 04999 | 32.5741 | 32.57049833 | 32.561 0267 | 32.555 02 | 32.552 28 | 32.617 5 | |
| Altitude | 1212 | 1172 | 1187 | 1165 | 1194 | 1213 | 1192 | 1159 | |
| 3 | Latitude | 03282 15 | 033480 0000 | 0.3281 | 0.32166 63333 | 0.3234 | 0.3654 63 | 0.3608 95 | 0.3634 |
| Longitude | 32.593 256 | 32.6014 8 | 32.556 4 | 32.615865 | 32.556 4 | 32.603058 | 32.561 648 | 32.663 4 | |
| Altitude | 1215 | 1178 | 1206 | 1163 | 1206 | 1198 | 1195 | 1178 | |
| 4 | Latitude | 0.3369 98 | 0.34070 16666 | 0.338033 | 0.34417333 | 0.3320 315 | 0.566 6 | 0.3672 95 | 0.3802 |
| Longitude | 32.857303 | 32.5888 2333 | 32.6052317 | 32.61251 | 32.620 1275 | 32.61553 | 32.559543 | 32.557 1 | |
| Altitude | 1222 | 1220 | 1182 | 1196 | 1176 | 1226 | 1194 | 1221 | |
| 5 | Latitude | 0.3378 1 | 0.33747 6666 | 0.3263 89 | 0.34834 0 | 0.3485 786 | 0.3123 45 | 0.3622 68 | 0.3653 |
| Longitude | 32.672 39 | 32.5838 5 | 32.577 222 | 32.599286 | 32.619 7121 | 32.636113 | 32.62246 | 32.624 9 | |
| Altitude | 1167 | 1212 | 1236 | 1229 | 1195 | 1164 | 1198 | 1220 | |
| 6 | Latitude | 0.3369 98 | 0.33641 | 0.3437 7333 | 0.36100 8333 | 0.3526 773 | 0.3608 95 | 0.3539 | 0.378564 |
| Longitude | 32.587 303 | 32.5826 81666 | 32.585 6083 | 32599863 | 32.608 873 | 32.56 648 | 32.636 8 | 32.845 64 | |
| Altitude | 1202 | 1207 | 1185 | 1200 | 1230 | 1195 | 1194 | 32.8451155 | |
| 7 | Latitude | 0.33702833 | 0.32189 83333 | 0.32368 | 0.33491 6 | 0.3626862 | 0.3021 66 | 0.3043 56 | 0.2954 |
| longitude | 32.589 6266 | 32.6043 3833 | 3257712 | 32.5663 01 | 32.601 4431 | 32.552 638 | 32.643 552 | 32.542 4 | |
| Altitude | 1255 | 1162 | 1181 | 1249 | 1197 | 1261 | 1162 | 1164 |
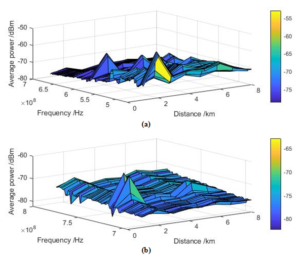
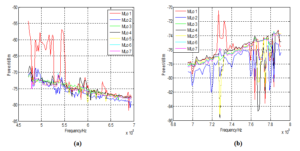
In general, as seen in Figure 3, experimental results show that all Measurement Locations (MLo) on the different distances from the transmitter have a good reception of digital television signals.
Figure 3. Radiofrequency intensity at different measurement locations for the different distances: The frequency ranges are 470 MHz-694 MHz for (a) and 694 MHz -790 MHz for (b)
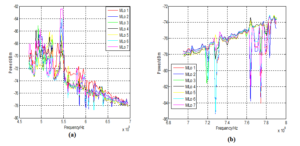
Theoretically, radiofrequency intensities at a constant distance from the broadcasting transmitter must be constant. However, this is not the case as seen in Figures 3-7 since the graphs obtained show that radiofrequency intensities vary with location for the same distance though measurements were taken at the least possible DLoS with the transmitter at every measurement location. This means that in some locations there are more obstacles yielding to low radiofrequency intensities while in some there a few obstacles leading to high values of radiofrequency intensities. This cause may also be due to multipath effects giving graphs of varying radiofrequency intensities
This same trend was also observed on the different MLos of the; 2 km, 4 km, 6 km and the 8 km distances. From Table 2, every concentric circle has different altitudes for the different Measurement locations indicating that some MLos are in the valley while as others are on the hill; hence differences in RF Intensities for the same CC.
Figure 4. Radiofrequency intensities at various measurement locations for the 3 km distance from the transmitter. The frequency ranges are 470 MHz-694 MHz for (a) and 694 MHz -790 MHz for (b)
Figure 5. Radiofrequency intensities at various measurement locations for the 3 km distance from the transmitter. The frequency ranges are 470 MHz-694 MHz for (a) and 694 MHz -790 MHz for (b)
Figure 6. Radiofrequency intensities at various measurement locations for the 5 km distance from the transmitter. The frequency ranges are 470 MHz-694 MHz for (a) and 694 MHz -790 MHz for (b)
Figure 7. Radiofrequency intensities at various measurement locations for the 7 km distance from the transmitter. The frequency ranges are 470 MHz-694 MHz for (a) and 694 MHz -790 MHz for (b)
Another observation made here is that there is a general decrease in the radiofrequency intensities with increasing frequency for the 470 MHz -694 MHz frequency band while as for the 694 MHz -790 MHz frequency band, there is a slight general increase in the radiofrequency intensities as the frequency increases, for every measurement location of every frequency value. This also means that more TV stations are located within the sub 700 MHz frequency band than in the 700 MHz frequency band.
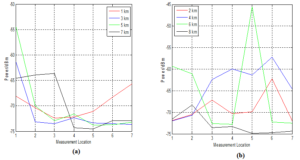
When a single frequency value of 542 MHz from the sub 700 MHz frequency band was considered, for each distance with its MLos as seen in Figures 8 below, the RF intensity for every MLo for a particular concentric distance from the transmitter is not constant [18]. This is because different MLos on the same concentric circle had different altitudes, hence giving different values of RF intensities on the same concentric circle. Specifically, MLos on CC2, CC4 and CC6, recorded higher values than those ones on CC1, CC3 and CC5, yet CC1, CC3 and CC5 are closer to the transmitter than CC2, CC3 and CC6, respectively. This same difference was also observed on the 740 MHz frequency selected from the 700 MH frequency band. These observations do not conform to the inverse square law and the mathematical expression as shown in Equation (1).
Figure 8. Radiofrequency intensities at various measurement locations of different distances from the transmitter for the 542 MHz frequency taken from the sub 700 MHz frequency band
From Figure 9, it is noted that there is total non-observance of the inverse square law. In (a), it is expected that RF intensities at all MLos on the 1km distance would be greater than the rest of the RF intensities for all other distances, but it was not so. This also applies in (b) for the 2 km RF intensities at all the MLos on the 2 km in comparison to other distances from the transmitter [4]. The same was observed for the 740 MHz frequency selected from the 700 MHz frequency band.
Figure 9. Radiofrequency intensities at various measurement locations of different distances from the transmitter for the 542 MHz frequency taken from the sub 700 MHz frequency band. The distances are odd for (a) and even for (b)
4. Conclusion
In this paper, radiofrequency intensities from the Digital Terrestrial Television (DTTV) Broadcasting Transmitter in Kampala Metropolitan have been measured and analyzed. The measurements generally show that there is a variation of radiofrequency intensities for a constant distance from the DVB-T Transmitter for any point around it. The measurements have shown that the sub 700 MHz frequency band of 470 MHz-694 MHz is more utilized than the 700 MHz frequency band of 694MHz-790 MHz; though both bands are still less utilized as being expected by ITU and UCC. The study has also revealed that in Kampala Metropolitan, there is good reception of DTTV signals at all the Measurement Locations where DTTV RF intensities measurements where carried from. The measurements do not obey the inverse square law which governs all forms of radiation in free space. This is evidenced on comparison of the RF Intensity measurements of CC1 with CC2, CC3 with CC4, CC5 with CC6 and CC7 with CC8. This is due to different Measurement Locations on the same CC having different altitude values. The study has come at the rightful time when there is an increase in the number of DVB-television stations in Kampala Metropolitan, Uganda.Acknowledgments
The authors are indebted to Dr. Akisophel Kisolo for providing the transport means that were used while collecting the data from the different measurement locations and extend their thanks to Dr. Gertrude Ayugi for providing the Spectrum Analyzer that was used in this study.Author Contributions
All authors contributed equally to the writing of this paper. All authors read and approved the final manuscript.Conflicts of Interest
The authors declare no conflict of interest.References
- Whitaker, J. C. (2005). Standard Handbook of Broadcast Engineering. McGraw-Hill Education. [Google Scholor]
- Akinbolati, A., Ajewole, M. O., Adediji, A. T., & Ojo, J. S. (2015). Determination and classification of coverage areas of terrestrial UHF television transmitters in Ondo state, Nigeria. International Organization of Scientific Research, Journal of Applied Physics (IOSR-JAP),7(4), 16-26. [Google Scholor]
- Murithi, K. K. M. (2001). IP Multicast in Digital Television Transmission Infrastructure, Doctoral dissertation. Massachusetts Institute of Technology, United States. [Google Scholor]
- Akinsanmi, A., Oludare, A. M., Titus, A. A., & Sunday, O. J. (2017). The influences of meteorological parameters on digital terrestrial television (DTT) signal in the tropics. International Journal of Digital Information and Wireless Communications, 7(3), 161-173. [Google Scholor]
- Ajewole, M. O., Akinbolati, A., Adediji, A. T., & Ojo, J. S. (2014). Precipitation effect on the coverage areas of terrestrial UHF television stations in Ondo state, Nigeria. International Journal of Engineering and Technology, 4(9), 524-535. [Google Scholor]
- Kerr, D. E., Goudsmit, S. A., & Linford, L. B. (Eds.). (1987). Propagation of Short Radio Waves (Vol. 24). IET Digital Library. [Google Scholor]
- Kenedy, G., & Bernard, D. (1992). Electronic communication system. In McGraw-Hill/Macmillan, Singapore (pp. 80-85). [Google Scholor]
- Akinbolati, A., Akinsanmi, O., & Ekundayo, K. R. (2016). Signal strength variation and propagation profiles of UHF radio wave channel in Ondo state, Nigeria. International Journal of Microwave and Wireless Technologies, 6(4), 12-27. [Google Scholor]
- Nagumo, S., & Walker, D. A. (1989). Ocean bottom geoscience observatories: Reuse of transoceanic telecommunications cables. Eos, Transactions American Geophysical Union, 70(26), 673-677. [Google Scholor]
- Nyabuga, G., Booker, N., Dragomir, M., Thompson, M., Jamaï, A., Chan, Y. Y., & Nissen, C. S. (2013). Mapping digital media: Kenya. Nairobi: Open Society Foundations. [Google Scholor]
- Akinbolati, A., Ikechiamaka, N. F., & Akoma D. B. (2017). Variation of Digital Terrestrial Television Signal with Altitude in Akure, South West Nigeria. American Journal of Engineering Research, 6(12), 186-194. [Google Scholor]
- Assia Semmar., Jean-Yves Chouinard., Viet Ha Pham., Xianbin Wang, Yiyan Wu., & Sébastien Laflèche. (2006). Digital Broadcasting Television Channel Measurements and Characterization for SIMO Mobile Reception. IEEE Transactions on Broadcasting, 52(4), 450-463. [Google Scholor]
- Armoogum, V. K. M. S., Soyjaudah, K. M. S., Mohamudally, N., & Fogarty, T. (2010). Propagation models and their applications in digital television broadcast network design and implementation. In Book: Trends in Telecommunications Technologies, 165-183. [Google Scholor]
- Prasad, M. V. S. N. (2006). Path loss exponents deduced from VHF & UHF measurements over Indian subcontinent and model comparison. IEEE Transactions on Broadcasting, 52(3), 290-298. [Google Scholor]
- Federal Communications Commission (FCC), Second report and order and memorandum. Opinion and order, Techical Report 08-260, November 2008. [Google Scholor]
- IEEE 802.22 Working Group. (2008). IEEE P802. 22/D1. 0 draft standard for wireless regional area networks part 22: cognitive wireless RAN medium access control (MAC) and physical layer (PHY) specifications: policies and procedures for operation in the TV bands. IEEE docs, 22-06. [Google Scholor]
- Saunders, S. R., & Aragï, A. (2007). Antennas and Propagation for Wireless Communication Systems. John Wiley & Sons. [Google Scholor]
- Fogarty, T., Soyjaudah, K. M. S., & Armoogum, V. T., & Mohamudally, N.(2006). Signal strength variation measurements of digital television broadcasting for summer season in the north of Mauritius at UHF bands. In Proceedings of the 3rd International Conference on Computers and Device for Communication. [Google Scholor]

