
University campuses have become challenging operational environments for both environmental pollution (e.g., waste accumulation, irregular recycling) and crowd management (e.g., emergency evacuation, safety planning) due to growing numbers of students and visitors, vast open spaces, and multiple sources of waste generation. Existing approaches such as periodic field patrols, fixed CCTV systems, and embedded sensor networks either incur high personnel and maintenance costs or fail to provide sufficiently detailed, real-time, location-specific data [1, 2].
Conventional methods for waste collection and crowd control are often limited. On many campuses, waste bins are emptied at fixed intervals, during which containers may overflow, creating odor issues and health hazards [3]. Khan and Naseer [4] emphasize that traditional campus waste management cannot resolve the problem of “unsanitary and overflowing bins,” arguing that bin fill levels must be monitored in real time. Likewise, crowd management relying on stationary cameras and patrol personnel is inadequate: monitoring hundreds of people spread across a large area with only a few staff members is impractical, and fixed cameras can miss movement outside their fields of view [5]. Liao and Juang [6] report that coastal waste-monitoring applications typically depend on human patrols or fixed observation stations, which cover only limited areas. Moreover, sensor- or camera-based fixed systems lack the ability to automatically provide detailed information about detected waste. Taken together, these studies reveal the shortcomings of traditional environmental management systems and clearly indicate the need for a smarter, more comprehensive monitoring solution at the campus scale. Location-based analytics and density mapping techniques are essential for real-time tracking of pollution and crowd density across campus. For example, mapping waste accumulation points by their geographic coordinates allows cleaning teams to allocate resources more efficiently. Similarly, generating real-time crowd density maps enables early detection of potentially hazardous bottlenecks or security risks. Drones have emerged as a particularly promising component in this context. A drone can quickly survey large campus areas and collect instantaneous image data. Equipped with onboard AI algorithms, these platforms transcend passive imaging to become intelligent observers capable of autonomous environmental monitoring.
Drones have demonstrably contributed to environmental monitoring applications and are critical for both pollution control and public safety, showing concrete benefits in these domains. For instance, one study [4] modified the YOLOv5 model by adding a specialized small-object detection layer to address challenges in detecting small waste items. This enhancement improved the capture of small litter in drone imagery. Additionally, by integrating a GPS module into the drone, researchers were able to geolocate detected waste items and visualize them within the user interface. The proposed system’s workflow is illustrated in Figure 1.
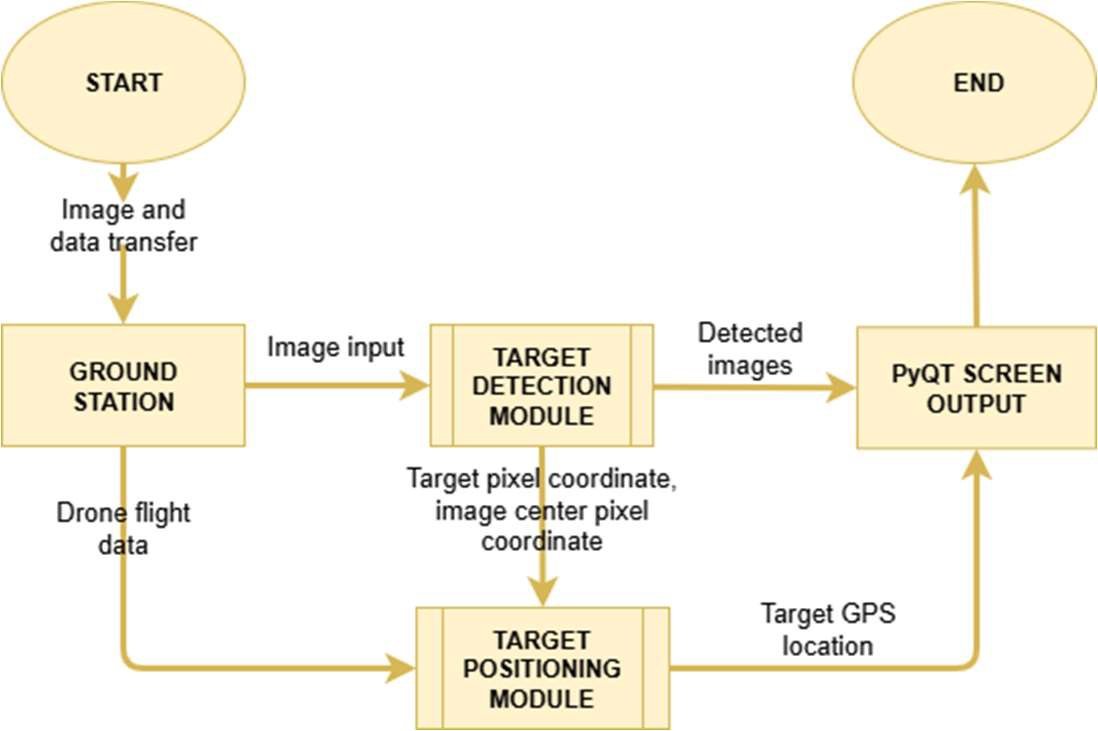
Images transmitted to the ground station are processed using a modified YOLOv5 model. When waste is detected, the corresponding location is determined using the drone’s GPS data and the pixel coordinates of the detection. A PyQtbased graphical user interface (GUI) was developed to display the collected images and the detection results.
Studies focusing on human detection similarly demonstrate that drone systems offer innovative solutions and ease of use in this domain. Parkavi et al. [7] utilized drones in their system designed for social distancing monitoring in the post-COVID-19 period. In their approach, individuals were detected in real-time video streams from public spaces using YOLOv5 and YOLOv6 algorithms, and Euclidean distance was calculated between individuals to determine violations of social distancing rules. This architecture integrates image acquisition via drone, deep learning–based human detection, and distance estimation, aiming to automate crowd monitoring under pandemic conditions. Similarly, Sheela and colleagues [8] focused on identifying crowd density and determining crowd locations in drone imagery for analysis and management purposes. Their proposed Temporal and Location-aware Fusion Attention model (TLFA_PF) combines spatial and temporal attention mechanisms to more accurately detect individuals within dense crowds. The system comprises data acquisition via drone, feature map processing using multi-scale deep networks, and the generation of real-time density maps enriched with geolocation data. This enables more precise crowd density estimation in public urban areas such as city centers, offering valuable technical support for security and event management. Another method for generating crowd density maps was proposed by Khangarot et al. [9], who used an Adaptive Gaussian Kernel (AGK) for processing drone-collected images. They introduced the DroneVision dataset and evaluated the performance of several convolutional neural network (CNN) models on this dataset. Their results demonstrated that the proposed method is optimized for crowd counting and density mapping using drone imagery collected from various heights and angles. In a related effort, Elharrouss and colleagues introduced the Drone-SCNet model for crowd density inference, reporting superior performance over other approaches in the literature [10]. Zhang et al. [11], on the other hand, focused on detecting extremely small-scale human figures in drone images using thermal and visible light fusion (RGB-T). Another study [12] applied a deep learning–based drone system in disaster zones for both disaster type classification and crowd density estimation. Using the CSRNet model with the Shanghaitech dataset, the system performed high-accuracy crowd counting in densely populated areas while also classifying disaster types such as fire, flooding, and building collapse via a CNN architecture. Furthermore, integrated systems that combine autonomous drones with SSD (Single Shot Detector)–based image processing models have been developed to support forensic investigation by reducing response time, enhancing safety, and improving the overall data collection process [13]. Table 1 presents a summary of recent object detection applications and studies utilizing drone-based image processing and artificial intelligence.
| Study | Objective | Drone Function | Method / Algorithm | Feature / Contribution | Dataset |
| [6] | Detection of marine debris and real-time alerting | Autonomous flight, image acquisition | YOLO (You Only Look Once) | Real-time streaming via Kafka Mongo for data analysis | HAIDA [14] |
| [7] | Social distancing monitoring in the post-COVID-19 period | Image acquisition | YOLOv5, YOLOv6 | Violation detection using Euclidean distance between individuals | – |
| [8] | Crowd density estimation and individual localization | Data collection, analysis | TLFA_PF (Temporal and Location-aware Fusion Attention) | Spatial-temporal attention for fine-grained individual detection | DroneCrowd [15, 16] |
| [9] | Crowd density map generation | Image acquisition | Adaptive Gaussian Kernel (AGK), CNN models | Optimized detection from various angles/heights; introduced DroneVision dataset | DroneVision |
| [10] | Crowd counting in drone imagery | Image acquisition, density mapping | Drone-SCNet (Scaled Cascade Network) | Enhanced scalable network for crowd counting | VisDrone2020, UCF-QNRF, JHU-CROWD, F_CC_50, ShanghaiTech (A,B) |
| [11] | Small-scale human detection in RGBT drone imagery | Wide-area, multi-modal image | QFDet (Quality-aware RGBT Fusion Detector) | Tackles tiny objects, modality imbalance, and positional drift; introduces two new datasets | RGBTDronePerson, VTUAV-dataset |
| [12] | Disaster classification and crowd density estimation in emergency zones | Image acquisition | CSRNet (crowd counting), CNN (disaster classification), modified CSRNet | Combines dense crowd counting and disaster-type classification | AIDER, ShanghaiTech |
| [13] | Enhancing crime scene investigation through time efficiency and safety | Autonomous navigation, image acquisition | SSD (Single Shot Detector) | Detection of vehicles and humans at crime scenes; safety-focused enhancement | – |
| [17] | Object detection optimization in high-altitude thermal UAV images | Thermal imaging from high altitude | YOLOX family (YOLOX-L, YOLOX-tiny, YOLOX-nano) | Evaluation on infrared thermal imagery from high altitudes | HIT-UAV [18] |
| [19] | Plastic waste detection and tracking | Image acquisition | YOLOv8 | Accurate identification of areas with high plastic waste concentration | – |
| [20] | Waste detection and classification in fruit orchards | Not yet integrated | Lightweight YOLOv7 with supervised contrastive learning | Custom YOLOv7 model for orchard environments; separates compostable pruning waste from toxic materials | – |
The studies provide detailed insights into drone-based waste detection and crowd density analysis and demonstrate that significant progress has been made in these fields. The developed object detection methods facilitate the identification of human and waste objects and serve as a foundation for infrastructures that simplify environmental management. However, most of these studies focus on a single problem either on the classification and tracking of environmental waste or on the analysis of human density and behavior. The system architectures are typically optimized for only one scenario (e.g., coastal cleanup, social distancing monitoring, or post-disaster crowd analysis). In contrast to the existing literature, this study proposes a multi-purpose and modular system that integrates the detection of both waste and human density on a single drone platform, processing human and waste data in spatial and temporal contexts to generate meaningful maps and decision-support outputs. The system not only detects objects but also maps the detected targets using GPS coordinates and ensures that these maps contribute to operational processes such as environmental intervention, cleaning planning, or security measures. The main objective of this study is to develop a drone-based and AI-supported integrated imaging and analysis infrastructure to address the identified gap in the literature. In this context, the system aims to collect visual data via a drone along predefined route points within the university campus, detect waste and human objects in these images with high accuracy using deep learning models, and generate density and heat maps from the collected data to provide real-time, data-driven information to environmental and security units. Moreover, the developed system enables the analysis of the spatial and temporal relationship between human activity and environmental pollution within the campus, thus offering a powerful and innovative infrastructure for proactively improving cleaning and security operations. In this respect, the study constitutes an important step towards developing intelligent and sustainable environmental management strategies on university campuses.
The system developed within the scope of this project consists of four core functional components: image acquisition, object detection, location-based analysis, and density mapping. The system design is based on capturing images at predefined points via drone, analyzing these images through AI-based models, geolocating the detected objects (human and waste), and converting this data into spatial density maps. All these steps operate in synchronization to support decision-making processes related to cleaning, security, and environmental management. The system workflow diagram is presented in Figure 2.
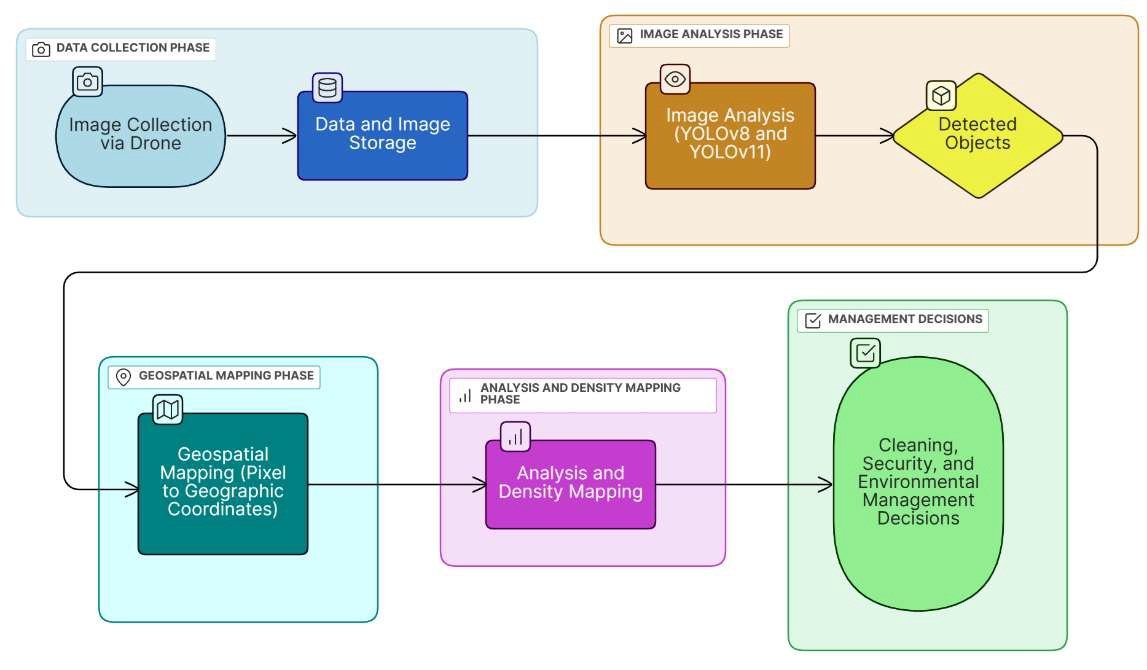
The system architecture is structured to enable the flow of information among the following components:
Data Collection Stage: The drone captures images from predetermined route points at specific angles and altitudes. Each image is automatically associated with Exif metadata including location (GPS), timestamp, and camera orientation (yaw, pitch, roll).
Image Analysis Stage: The collected images are processed by a deep learning model based on YOLOv8 and YOLOv11, trained for waste and human detection. The model extracts the object classes present in the image along with their bounding box coordinates.
Geospatial Mapping Stage: The pixel coordinates of the detected objects are converted into geographic coordinates using the Exif data recorded at the time of capture. As a result, each detected waste or human instance is represented on the map with precise location information.
Analysis and Density Mapping Stage: The geospatial data are analyzed using grid-based or kernel density estimation methods to produce waste density and human density maps over the target area. These maps can also be analyzed comparatively over time.
In this study, the DJI Mini 4 Pro model was selected as the image acquisition platform. The DJI Mini 4 Pro is capable of generating Exif metadata at the time of capture. Exif metadata is a data format embedded in digital image files that contains detailed information about the shot, including timestamp, GPS coordinates (latitude and longitude), altitude, camera orientation data (yaw, pitch, roll), and camera settings. These data are provided with an accuracy of ±0.5 m using the GPS + Galileo + BeiDou GNSS systems and can reach ±0.1 m accuracy with vision positioning. The Exif metadata are extracted from the microSD card after the flight using ExifTool and are used to estimate object locations approximately within the global coordinate system (see Table 2).
These data are processed as the primary input source for generating density maps. This feature ensures that each image is recorded along with its corresponding positioning and orientation metadata, which is then used by the system’s geolocation module to estimate the approximate position of detected objects in the global coordinate system. The images captured by the high-resolution camera mounted on the drone are stored on high-speed microSD cards and transferred to the ground station after each flight for further analysis. This ensures that the collected imagery is stored efficiently and reliably.
| Date-Time | Latitude (°) | Longitude (°) | Altitude (m) | Gimbal Yaw (°) | Gimbal Pitch (°) | Gimbal Roll (°) | Flight Yaw (°) | Flight Pitch (°) | Flight Roll (°) |
| 2025:05:03 | 38° 22′ | 27° 1′ | 392.7 m | -11.3 | -2.6 | +0.00 | +8.40 | +31.90 | -1.8 |
| 13:31:16 | 30.36” N | 50.59” E | |||||||
| 2025:05:03 | 38° 22′ | 27° 1′ | 392.7 m | -0.5 | -5.4 | +0.00 | +19.50 | -0.1 | -2.4 |
| 13:31:23 | 30.43” N | 50.60” E | |||||||
| 2025:05:03 | 38° 22′ | 27° 1′ | 394.3 m | -20.7 | -1.9 | +0.00 | -5.0 | +25.10 | -20.7 |
| 13:31:37 | 32.61” N | 53.40” E | |||||||
| 2025:05:03 | 38° 22′ | 27° 1′ | 394.2 m | +102.80 | -3.6 | +0.00 | +122.80 | -1.3 | +0.00 |
| 13:31:46 | 32.66” N | 53.40” E | |||||||
| 2025:05:03 | 38° 22′ | 27° 1′ | 394 m | -17.1 | -7.2 | +0.00 | +3.10 | +2.60 | +1.90 |
| 13:31:56 | 32.66” N | 53.41” E | |||||||
| 2025:05:03 | 38° 22′ | 27° 1′ | 476.1 m | -0.7 | -6.4 | +0.00 | +19.60 | -0.5 | -5.9 |
| 13:34:17 | 26.98” N | 42.64” E |
For the tasks of detecting waste and humans from drone-collected imagery, deep learning–based YOLO (You Only Look Once) models were employed. YOLO models are widely used in object detection as they combine high accuracy and real-time performance within a unified, end-to-end architecture. The core principle of YOLO is to divide the input image into a grid structure and to predict, in a single pass, the object classes, bounding box coordinates, and confidence scores for each grid cell [21]. This architecture offers fast processing and effective object recognition capabilities. The YOLO architecture consists of three main components: the Backbone, which extracts image features through convolutional layers; the Neck, which aggregates multi-scale features using mechanisms such as FPN or PANet; and the Head, which produces the final outputs including object classes, bounding box coordinates, and confidence scores [22, 23]. Over time, the YOLO architecture has undergone significant advancements, incorporating improvements such as anchor-free bounding box mechanisms, deeper backbone networks, and various architectural innovations that have boosted its overall performance. In this study, two different versions of the YOLO architecture were strategically selected based on the specific requirements of each detection task. Due to the small, irregular and visually complex nature of waste objects, the deeper and more parameter-rich YOLOv8x model was chosen to better capture fine-grained details. For human detection, the YOLOv11n model was selected due to its lightweight and optimized structure, which enables real-time performance while maintaining accuracy. This model is well-suited for detecting human silhouettes, which generally exhibit consistent shape and structural integrity. This selection aims to maximize overall system efficiency and responsiveness. In conclusion, the developed system integrates drone-based data acquisition, precise geolocation, effective image analysis, and comprehensive density mapping to provide an innovative and data-driven infrastructure for campus environmental management processes.
This section details the methodology and general system architecture of the drone-based intelligent analysis system developed for detecting environmental pollution and determining spatial usage density on university campuses. The proposed approach integrates drone technology, AI-based object detection models, and location-based analysis methods to support environmental management and security operations in campus environments. The system workflow is presented in Figure 3.
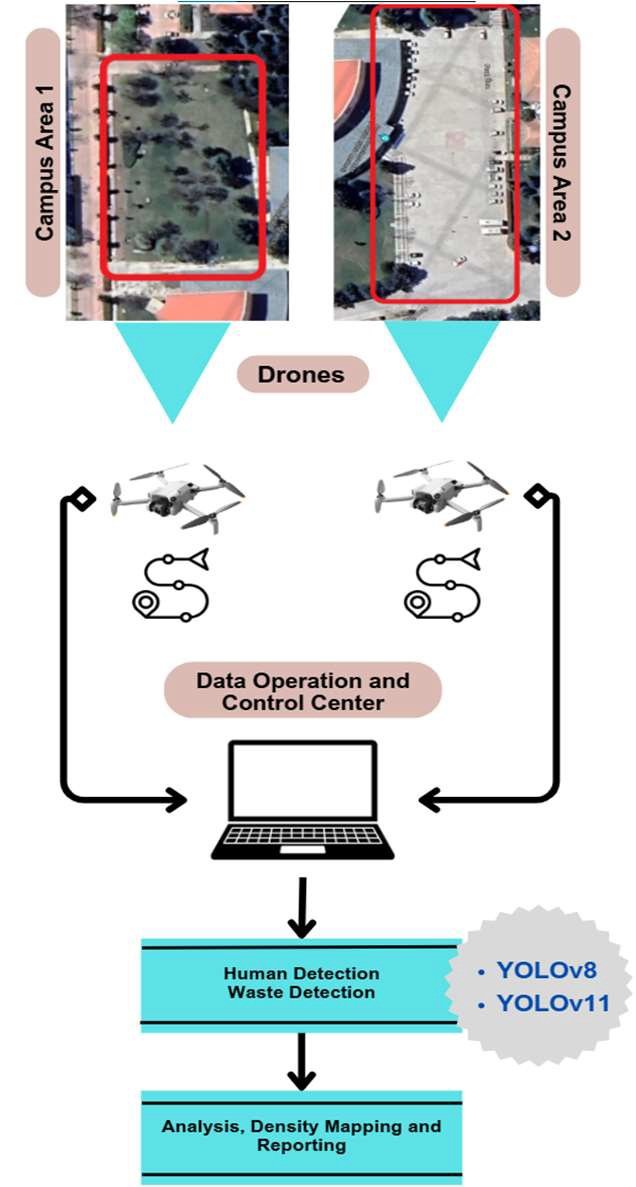
The developed system consists of processes for fast and high-resolution image acquisition via drone, object analysis using deep learning models, geospatial mapping of detected data, and generation of spatial density maps using Geographic Information Systems (GIS). In the initial phase, the drone performs flights according to predefined route points within the campus. The images captured during each flight are automatically associated with Exif metadata, including GPS coordinates, altitude, and camera orientation angles (yaw, pitch, roll). These images are then transferred to the control center for analysis.
At the control center, the collected images are processed using deep learning models based on YOLOv8 and YOLOv11 to detect waste and human objects. For each detection, bounding box coordinates and object classes are identified. Then, the pixel coordinates in the image are combined with Exif metadata from the drone to compute the geographic coordinates of the detected objects. These coordinates are analyzed using Kernel Density Estimation methods to generate maps showing waste and human density in the campus area. These density maps serve as important data sources for environmental cleaning and security operations.
The effectiveness and accuracy of the developed system depend significantly on the quality and diversity of the datasets used. To develop robust models capable of accurately detecting humans and waste from drone imagery, a comprehensive data preparation process was implemented. For human detection, the “Aerial Person Detection” [24], “Linhas” [25], and “VisDrone” [15, 16] datasets were combined. These datasets offer a wide variety of images showing people from different altitudes and angles. For waste detection, the “UAVVaste Dataset” [26] and “Aerial Garbage Detection” [27] datasets were utilized. Since the datasets contained multiple object classes, irrelevant class labels and corresponding images were removed. These datasets represent various waste types and environmental conditions.
The combined datasets were formatted according to the YOLO labeling standard and resized to a standard resolution of 640×640 pixels. For waste detection, data augmentation techniques such as rotation, horizontal flipping, brightness and contrast adjustments, and noise addition were applied to improve model adaptability to diverse conditions. For human detection, orientation-preserving transformations like rotation and flipping were avoided due to the generally upright posture of human figures. As a result, a comprehensive dataset consisting of 13,668 images for human detection and 12,211 images for waste detection was constructed. Both datasets were split into training (80%), validation (10%), and test (10%) subsets for model development.
Separate model architectures were strategically selected for waste and human detection tasks. For waste detection, the YOLOv8x model was chosen due to its ability to accurately detect complex visual patterns and small objects. For human detection, the YOLOv11n model was employed, offering faster processing and satisfactory accuracy levels. During training, the AdamW optimization algorithm was used with a learning rate of 0.001 to achieve high performance. Training was conducted on the Google Colab platform using an Nvidia A100 GPU. In the implementation phase, inference was performed on a system equipped with an Nvidia 1650 Ti GPU.
The geographic coordinates of the detected objects (human and waste) in the drone images are computed based on the drone’s position and orientation data at the time of image capture. These data include the drone’s GPS coordinates (latitude and longitude), altitude, and camera orientation angles (yaw, pitch, and roll). Separate coordinate systems were defined for the drone and the camera. While the drone’s local coordinate system is constructed using GPS and sensor data during flight, the camera coordinate system is determined by the gimbal angles that control the camera’s orientation. To determine the total orientation of the drone and the camera, rotation matrices based on yaw, pitch, and roll angles were used. The rotation on each axis was combined to compute the camera’s orientation relative to the world coordinate system. Then, the pixel center coordinates of detected objects, provided by the YOLO model, were converted into angular values using the camera’s Field of View (FOV). The resulting horizontal and vertical angles were applied to the total orientation matrix along with the drone’s altitude to determine the relative position of the object with respect to the drone.
Finally, this relative position (x and y distances in meters) was added to the drone’s current GPS position to approximately compute the object’s real-world coordinates (latitude and longitude). In this step, the Haversine formula was used for global coordinate transformation. This method ensures that each object is accurately represented on the map. However, surface slope or terrain irregularities are acknowledged as limitations of this approach.
\[\label{eq1} \begin{bmatrix} x_{\text{world}} \\ y_{\text{world}} \end{bmatrix} = R_{\text{total}}(\theta, \phi, \psi) \begin{bmatrix} (x_{\text{center}} – 0.5) \cdot \text{HFOV} \\ (0.5 – y_{\text{center}}) \cdot \text{VFOV} \\ h \end{bmatrix}. \tag{1}\]
In Eq. (1), \(R_{\text{total}}(\theta, \phi, \psi)\) represents the total rotation matrix derived from the yaw, pitch, and roll angles of the drone and camera. \(x_{\text{center}}, y_{\text{center}}\) are the normalized pixel coordinates of the object. HFOV and VFOV represent the camera’s horizontal and vertical fields of view, respectively, and \(h\) is the drone’s flight altitude. This equation summarizes the key mathematical operations for determining the world coordinates of detected objects based on the drone’s position and orientation. Rotation matrices accounting for drone and camera angular motion, along with FOV-based angular transformations from pixel coordinates, are jointly used in this process.
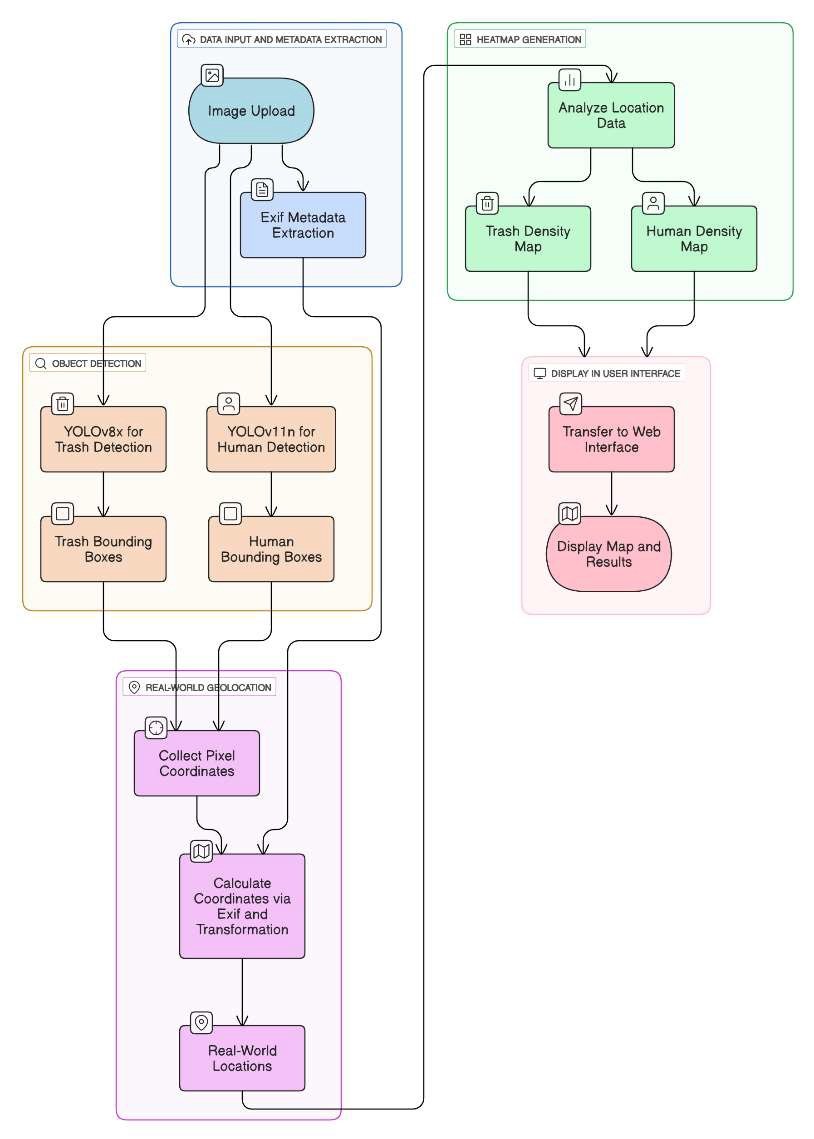
This section presents the experimental implementation processes and performance results of the drone-based intelligent analysis system described in the previous section. The training performance of the developed object detection models (YOLOv8x and YOLOv11n) is evaluated using standard metrics and visual analysis. Additionally, the geolocation of detected objects and the spatial density maps generated from this data are explained through sample scenarios. The implemented software integration consists of five main modules: data input and metadata extraction, object detection, geolocation, density map generation, and user interface visualization. The software workflow is shown in Figure 4.
YOLOv8x and YOLOv11n models were used for waste and human detection tasks in this study. The Precision metric, commonly used in the field of object detection, was selected for evaluating model performance. Model training was performed on Google Colab using an NVIDIA A100 GPU, and training was stopped at optimal performance points. Figure 5 presents the training accuracy and loss graphs for the YOLOv8x model used in waste detection, while Figure 6 shows the corresponding graphs for the YOLOv11n model used in human detection.
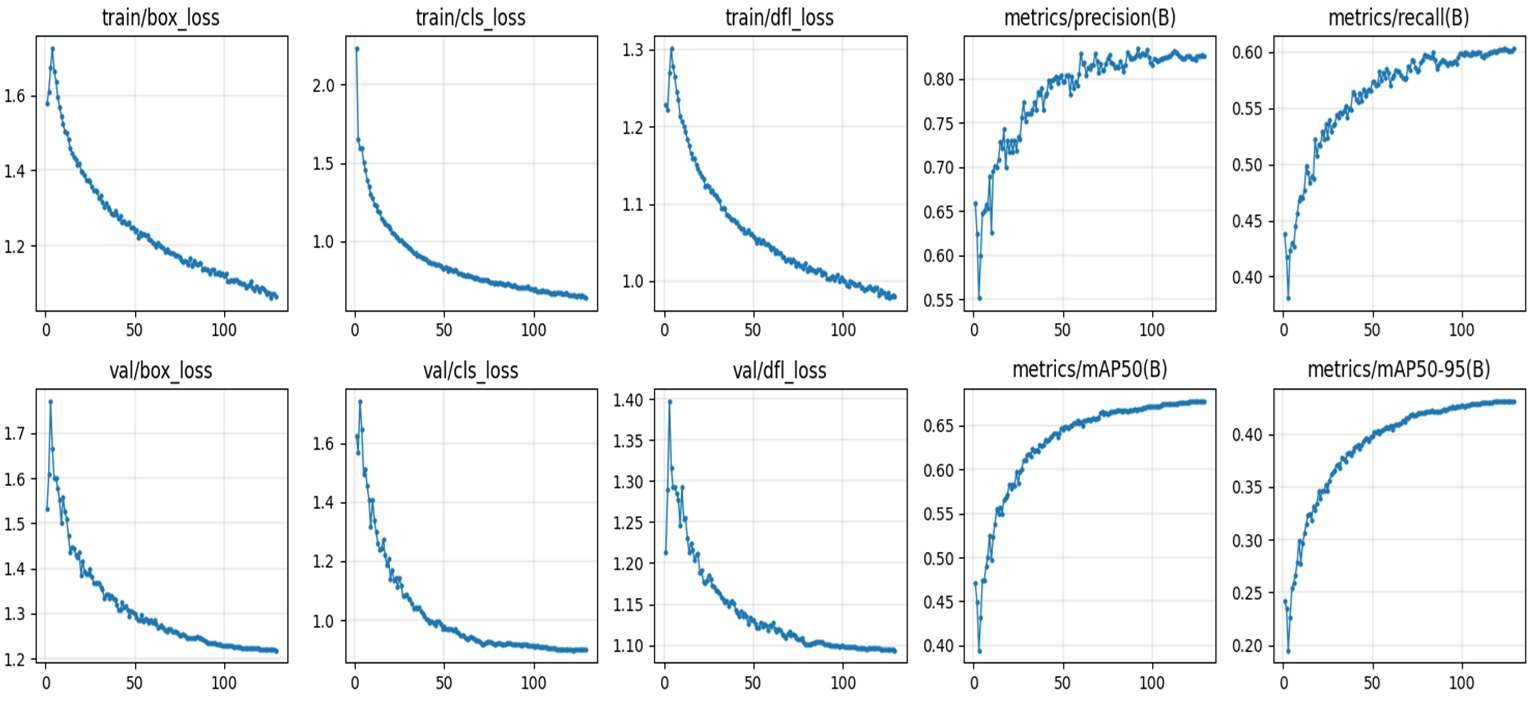
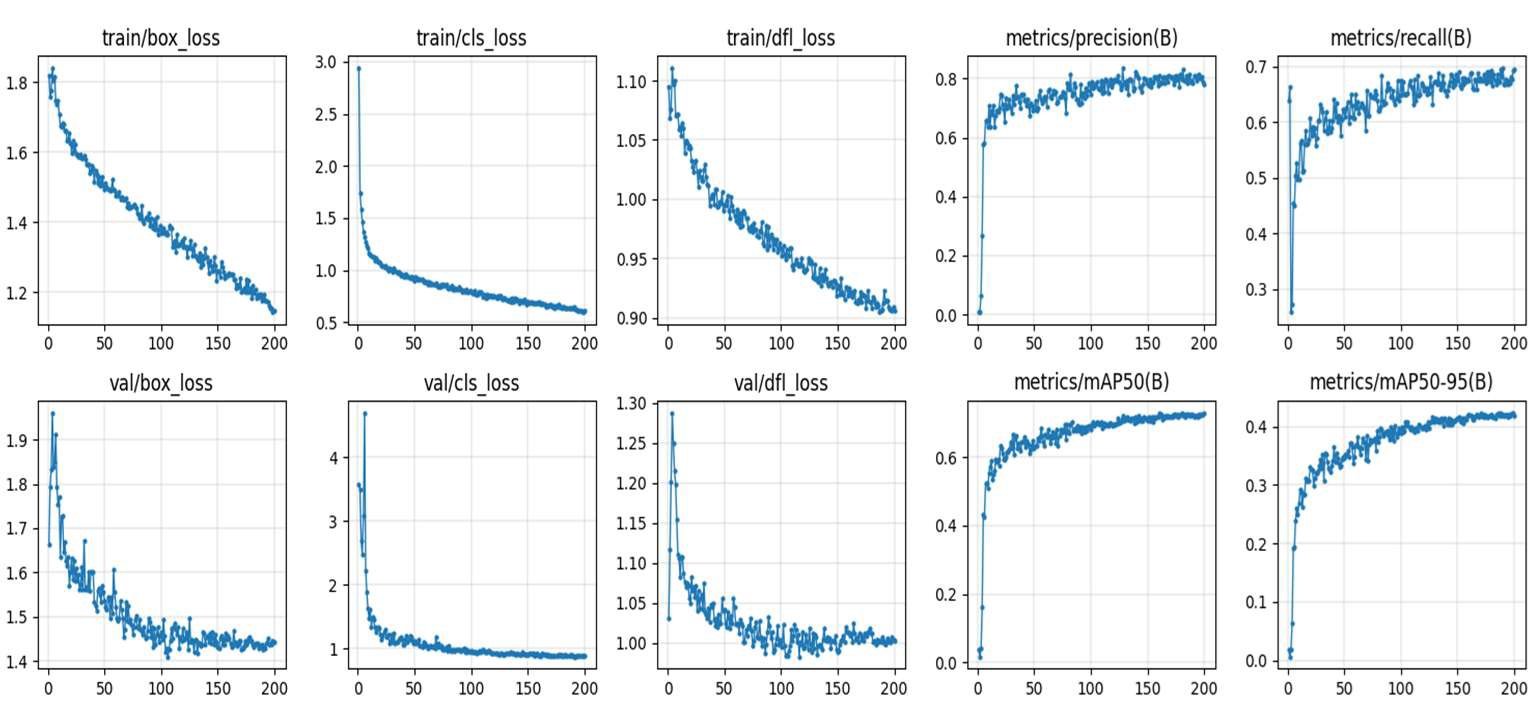
Evaluation on the test dataset showed that the waste detection model (YOLOv8x) achieved a precision of 85.87%, while the human detection model (YOLOv11n) reached 73.36% (Table 3). The results demonstrate the effectiveness of the developed models, especially on small and environmentally complex objects.
| Task | Model | Number of Test Images | Precision (P) |
|---|---|---|---|
| Waste Detection | YOLOv8x | 1027 | %85.8724 |
| Human Detection | YOLOv11n | 1495 | %73.3646 |
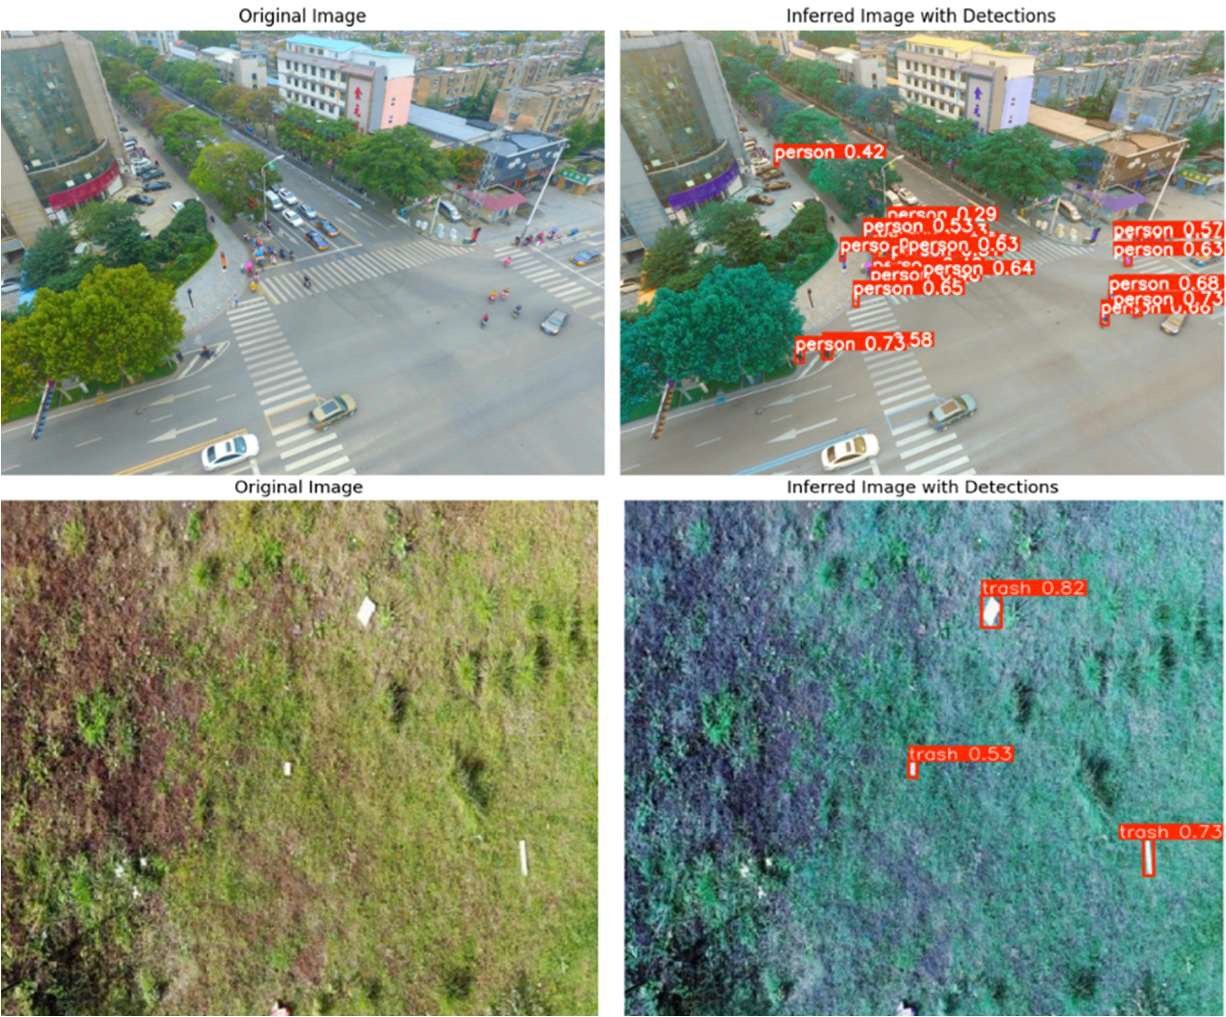
The high precision rate of 85.8724% for waste detection indicates that the model performs strongly in distinguishing waste objects in images with heavy background and environmental noise. For human detection, a satisfactory precision of 73.3646% was achieved. Figure 7 clearly illustrates the test results of the models on sample images.
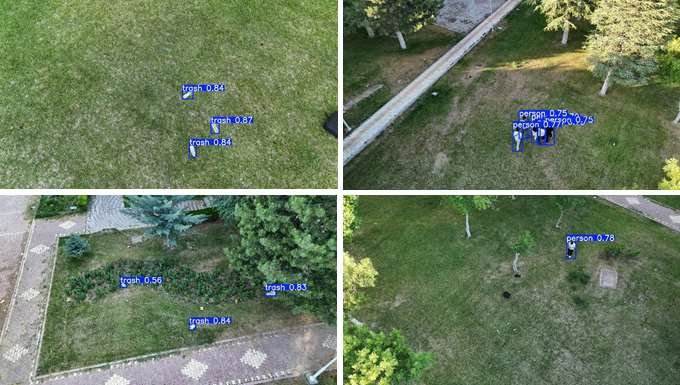
Object detection outputs obtained from the image processing models are combined with GPS coordinates calculated during the geolocation process to perform spatial distribution analysis. This analysis aims to quantitatively map waste and human densities in specific areas within the campus and generate actionable reports. The process includes three main stages: object counting, density map generation, and final report preparation. In the first stage, detected waste and human objects from the YOLOv8x and YOLOv11n models (Figure 8) are matched with full metadata extracted using ExifTool.
Each detected object is converted from image pixel coordinates into real-world coordinates using projection and rotation matrices. In this process, each coordinate pair is recorded as a data point. The total number of detected objects at campus observation points (e.g., in front of faculties, around parking lots, pedestrian crossings) forms the basis for localized density analysis. The collected coordinates are placed into a grid structure to create the density map. The map is divided into latitude and longitude intervals that cover the campus area. The KDE method is used for density estimation. KDE generates a smoothed and visually meaningful distribution by estimating density around each data point. This method helps highlight local clusters such as waste accumulation around parking lots or high pedestrian density at crosswalks. The computation is automated using the scipy.stats.gaussian_kde function in Python.
In the final stage of area density analysis, meaningful visual outputs and summary statistics are generated using the geolocation data of all detected human and waste objects. These outputs are presented to campus administrators through map-based visualization and data-driven reporting to support environmental decision-making.
Figure 9 shows two components of the system-generated visual output rendered via a Flask-based web interface. Subfigure (a) illustrates the density map visualization, where detection intensity is represented through a color scale, with a gradient from yellow to red indicating increasing density. Subfigure (b) presents the object detection map for the same area with labeled classes: each human detection is marked with a green user icon, while waste detections are marked with red trash bin icons. All icons are accurately matched with the confirmed GPS coordinates of the detected objects.
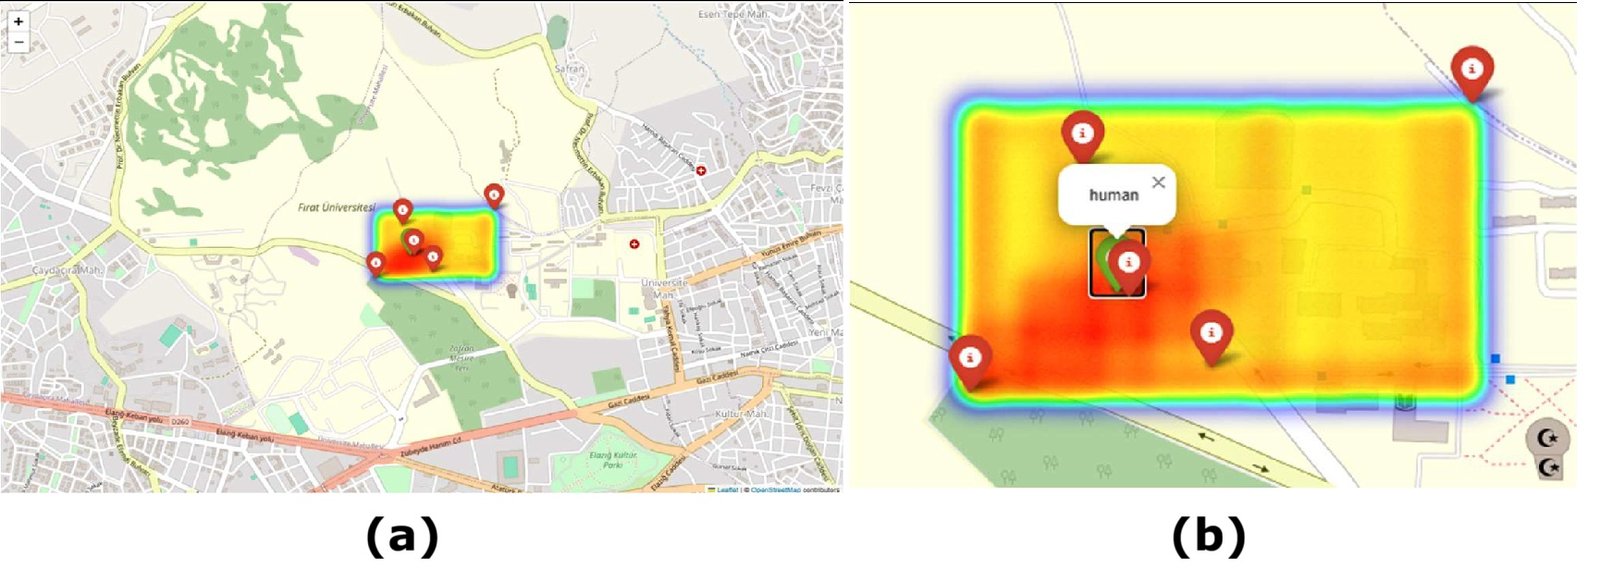
As shown, each detected object class is displayed on the map as a symbolic and separate layer. Green user icons represent human instances detected by the drone, while red trash bin icons indicate waste accumulations identified by the system. These icons are georeferenced with high precision to reflect true spatial locations. This visualization approach demonstrates that the system is not only capable of calculating numerical density but also directly meets the needs of location-based operational planning. For example, systematically correlating areas of waste clustering with human density patterns provides a directly usable dataset for efficient cleaning planning and environmental regulation strategies.
Moreover, the system is designed to operate in a periodic analysis cycle through repeated flights conducted at different times. This enables monitoring of temporal changes in density maps, which is highly beneficial for analyzing weekly waste accumulation trends or variations in human movement based on class start and end times. In this context, the developed system offers a multi-layered, integrated environmental monitoring infrastructure that combines object detection outputs, GPS-based geolocation algorithms, KDE-based density analytics, and map-based interactive visualization layers.
Today, urbanization and increasing human density bring about significant challenges such as environmental pollution (particularly solid waste) and crowd management, especially in open and public areas. These problems not only raise aesthetic concerns but also trigger public health risks, ecological degradation, and losses in operational efficiency. Traditional monitoring and environmental management methods rely on manual labor, making them time-consuming and costly over large areas. Similarly, fixed-camera systems often fall short due to their inability to perform dynamic scanning. This study addresses these issues by offering a solution for the accurate, rapid, and automated detection of environmental pollution and human density.
The study involves the design and implementation of an integrated intelligent system capable of simultaneously monitoring and managing two critical issues specific to university campuses: environmental pollution (waste) and human density. The system combines drone usage, image processing, object geolocation, and spatial density analysis techniques. In doing so, it provides a next-generation monitoring infrastructure in which environmental events can be evaluated in both spatial and temporal contexts. Beyond merely detecting specific objects, the system also converts these detections into geographic coordinates and integrates visualization and reporting capabilities to support environmental decision-making processes.
The system begins by extracting precise metadata (GPS, camera orientation data) from drone-captured images using ExifTool. Two object detection models were used: YOLOv8x for waste detection and YOLOv11n for human detection. These models achieved precision scores of 85.8724% for waste and 73.3646% for human detection. The pixel coordinates of detected objects were transformed into real-world geographic coordinates using extracted Exif data and positioning equations. These coordinates were then processed through the Kernel Density Estimation (KDE) method to generate spatial density maps. All resulting analysis outputs were delivered to users through a web interface and mapping libraries. This integrated approach effectively visualizes density hotspots and object counts for a designated area or across the campus.
The developed system offers both direct and indirect benefits. These include more efficient planning of cleaning services, proactive enhancement of campus security through crowd tracking, and real-time monitoring of environmental conditions to enable rapid response. Additionally, the project stands out as a pioneering effort to promote environmentally conscious technologies and contribute to the formation of sustainable campus ecosystems. In this regard, the study serves as a significant example of the intersection between technological advancement and environmental responsibility.
Despite its effectiveness, the current version of the system has some practical and technical limitations. The need to manually transfer image data via physical storage devices restricts real-time monitoring and immediate response capabilities. This can lead to processing delays in large-scale or rapidly changing scenarios. Moreover, the object detection models require further enhancement to detect smaller, closely positioned, or partially overlapping objects more accurately. Finally, sensitive tasks such as human detection and localization raise ethical concerns related to individual privacy, necessitating the strict implementation of data privacy protocols during data collection, processing, and storage. Future work will focus on overcoming these limitations to maximize the system’s autonomy, accuracy, and operational efficiency in environmental monitoring and management.