
Concrete is the most widely used building material. It is a composite building material consisting of an aggregate (coarse and fine aggregate), water, cement and chemical admixtures [1-4]. The ability and capacity of concrete to withstand the effects and influences of the environment while performing its designed function is termed durability of concrete. Concrete has magnificent structural performance and durability properties but when subjected to marine environment, early deterioration is experienced [5,6] submitted that about 71% of the Earth’s surface is covered by water and oceans hold 97% of the surface water. On the other hand, an enormous number of structures in our natural built environment are exposed to sea water with high salinity; either directly, or indirectly (the movement of sea water few miles inland from the coast by winds and other factors) [7]. As a result, numerous offshore and coastal oceanic structures are subjected to unceasing action of physical and chemical deterioration processes leading to the corrosion of steel reinforcement and subsequent concrete sapling [5].
The challenges faced by buildings and preserving durable concrete buildings in coastal surroundings have long become a major problem to does residing in these areas and this offers an outstanding opportunity to understand the intricacy of concrete durability issues in these areas. In [8] stated that, understanding the presence of some aggressive elements present in the environment and the pattern of their attack on concrete structures is a first line of action in designing buildings that can best resist those elements. Achour et al. [9] examined the durability study of concrete incorporating dredged sediments. The results of their findings revealed substantial differences in the behaviours of the two kinds of core samples having C1 concrete exhibiting better resistance to freeze/thaw cycles than C2 concrete. Also, C1 concrete recorded better resistance than C2 when suggested to external sulphate attacks of three different protocols (total immersion in a 5% \(Na_{2}SO_{4}.10H_{2}O\) solution, immersion/drying cycles at 60 and immersion/drying cycles at 105).
Albitar et al. [10] researched on the durability evaluation of geopolymer and conventional concretes. Specimens of geopolymer and conventional concretes were cured in four different chemical solutions: 5% sodium chloride, 5% sodium sulphate, 5% sodium sulphate + 5% magnesium sulphate, and 3% sulphuric acid. They discovered that the OPC concrete has lower water absorption and sorptivity than the geopolymer concrete. Also, sodium sulphate exhibited the greatest impact on geopolymer concretes, while OPC concrete is more susceptible to sulphuric acid attack and concluded that geopolymer concrete is more durable than OPC concrete within the examined exposure range.
Nagabhushana et al. [5] indicated that effective performance of marine structures built with concrete depends to a great extent on their durability against the aggressive marine environment. The chemical deterioration as a result of some attacks like leaching, sulphate and chloride; physical deterioration from abrasion, crystallization of soluble hydrated salts in pores of the concrete and erosion, promotes the collapse of concrete resulting in partial removal of the concrete cover, softening and cracking. Retno et al. [11] investigated the performance of early-age concrete with sea water curing. The experimental results showed that the compressive strength of 7 days and 14 days’ concrete specimens with seawater curing is higher than those cured in plain-water; about 2.56-5.25% for 7 days old specimens and 3.39-11.87% for 14 days old specimens. They also observed that the lower the w/c ratio, the higher the compressive strength of the concrete. They concluded that the compressive strength of 7 days and 14 days old concrete specimens cured in seawater were higher than specimens cured in potable water.
Falah [12] researched on the effect of seawater for mixing and curing on structural concrete. He observed that strength properties of concrete increased for samples produced and cured with seawater. The increase was shown to have occurred at early curing ages up to 28 days but decreased there after (beyond 28 days of curing). He concluded that the reduction in strength increased with increase in curing age in different curing medium. He further opined that this may be due to salt crystallization formation affecting the strength gain. Nagabhushana et al. [5] investigated the effect of salt water on compressive strength of concrete. The salt of various proportions (25, 30, 35, 40, 45) grams/litre of water was mixed with water to prepare the concrete specimens which were cured in fresh water. Other cubes were cast and cured in sea water. It was observed that various salt contents which were used for casting showed that there was increase in the compressive strength of concrete for low levels of salt content and there was decrease in compressive strength for high levels of salt content.
Nobuaki et al. [13] reported that some considerations like concrete reinforced with stainless steel or corrosion resistant reinforcement, the use of corrosion inhibitor and other blended cement instead of OPC may be used for producing concrete with sea water. Islam et al. [8] suggested that, if appropriate procedures are used in the selection of materials, reinforcement detailing, construction techniques, quality control methods and mix design, these durability challenges faced by concrete could be eradicated. The aim of this study is to investigate the effect of salinity on the structural strengths of conventional concrete. The objectives of this study are:
to determine the effect of aggressive medium on structural strengths (compressive, split-tensile and flexural strengths) of concrete subjected to various aggressive medium such as different level of salt concentrations and lagoon (sea) water for a period of 120 days.
to develop models for predicting some mechanical properties of concrete using Modified Regression Approach.
The cement used in this study was Ordinary Portland Cement (OPC) Dangote 3X Brand of cement grade 42.5R, which conforms to the requirements set under [14-17]. Coarse aggregates were crushed granite having a maximum aggregate size of 19mm, obtained from a quarry located in Ogun state, Nigeria. The fine aggregate used was river sand gotten from River Ogun, which was free from organic matter and salt. The water used for this study was clean, portable and impurities-free obtained from University of Lagos Water Distribution System in accordance with BS EN 1008 [18].
The design mix ratio was determined by volume and the proportions used for in this study are 346.50 \(kg/m^3\), 571.73 \(kg/m^3\), 1334 \(kg/m^3\) and 173.25 \(kg/m^3\) for cement, sand, granite and water respectively with a w/c ratio of 0.50 for a Grade 30 concrete. A mechanical concrete mixer was used in preparing the fresh concrete mix. The fresh concretes were poured unto various moulds for different test specimens and compacted using tapping rod and vibrating machine. The workability of the mix was determined and the specimens were demoulded after 24 \(\pm\) 2hrs of casting in the moulds and placed in the various curing medium till the test dates. Also, physio-chemical laboratory analysis was carried on lagoon water obtained at University of Lagos lagoon front (6’ 29”N, 3’ 8.19”E) to obtained the mass of total dissolved salts present. Chlorides had the highest concentration of 2600 \(mg/l\), amongst others. Based on this result, the saltwater aggressive medium simulated in the laboratory were prepared as follows Salt Water I (SW1) having 13,000 \(mg/l\) which is five times the chloride concentration of lagoon water and salt water II (SW2) having 26,000 \(mg/l\) which is ten times that chloride concentration of lagoon water.
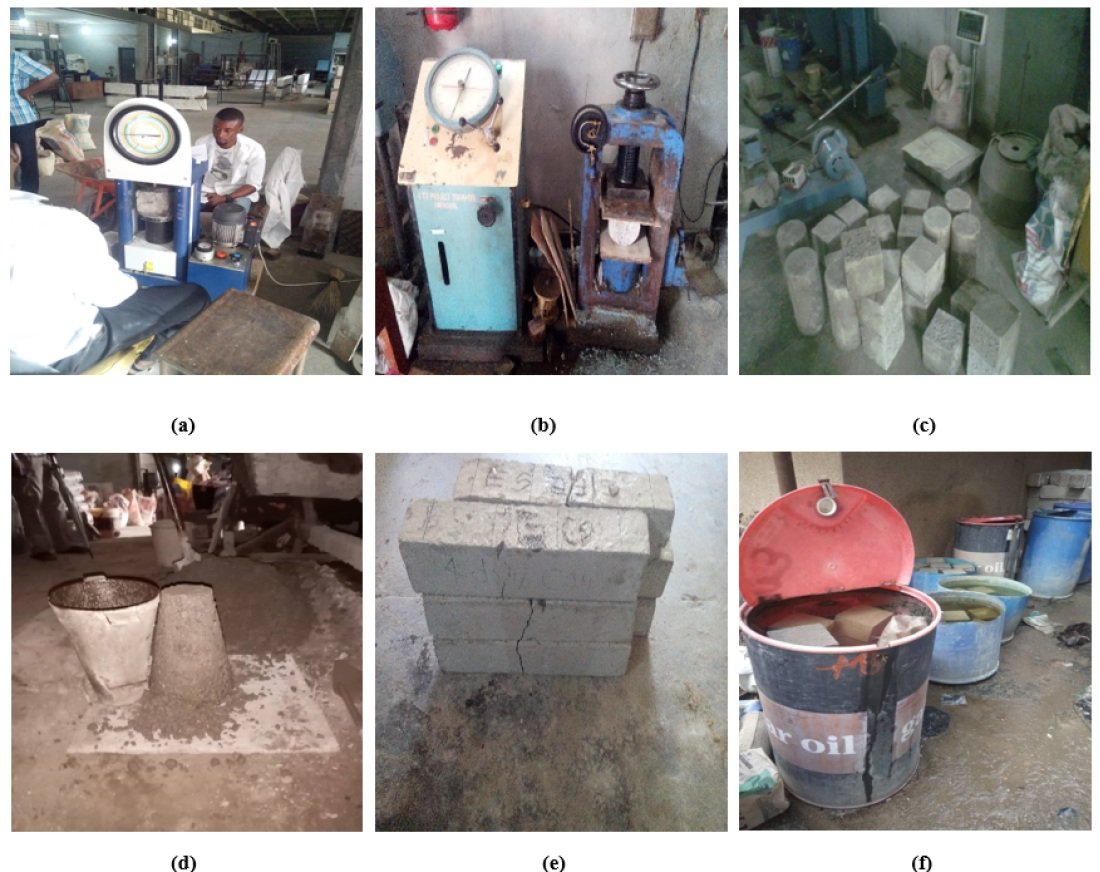
A total number of 72Nos. 150mm concrete cubes, 72Nos. 150mm \(\times\) 300mm concrete cylinders and 32Nos. 150mm \(\times\) 150mm \(\times\) 750mm beams specimens were cast, cured and tested. The specimens were tested as follows: 18nos test cubes, 28nos test cylinders and 8nos test beams were cured in each of Salt water I, Salt water II, Lagoon water and fresh (potable) water respectively. The preparation and curing of the specimens were in accordance with [19]. The specimens were de-moulded 24 hours after casting and stored in the different curing medium until the age of the test of 7, 14, 21, 28, 45, 90, 120 days for the cubes and cylinders, while 28, 45, 90,120 days were for the beams.
The subsequent tests were conducted on the cured concrete samples for each curing age and medium. Compressive strength test using Avery Dension Universal Testing Machine having a loading rate of 120 \(kN/min\) which is in accordance with [20]. Splitting tensile strength test in accordance with [21,22] using a loading rate of 120 \(kN/min\). Flexural strength test on thirty-two (32) beams without reinforcement under two points loading in accordance with [23].
The concrete recorded a slump value of 10mm which is classified as true slump while the initial and final setting time of the cement pastes which were 115 and 200 minutes respectively are within the specified standard of 600 minutes [24]. The compaction factor, a measure of the degree of work to be done on the concrete to have a well compacted concrete was found to be 0.89. This satisfies British Standard [25], which states that: for the normal range of concrete, the compacting factor lies between 0.80-0.92.
Mathematical models for predicting the structural strength of concrete cured in different curing medium were developed using Modified Regression Approach. The Modified Regression Approach was conducted using Microsoft Excel software to generate equations and coefficient tables for a given set of data.
The general form of equation to be selected is based on the R squared value and the pattern of the experimental data which could be linear, polynomial, logarithmic or exponential.
\[ \text{For Linear: } \ y = bx + a \label{1} \tag{1}\] \[\text{For Exponential: }\ \ y = ae^{bx}\label{2} \tag{2}\] \[\text{ For Logarithmic: }\ \ y = a*In(x) + b\label{3} \tag{3}\] \[\text{ For Polynomial: }\ \ y = b_{n+2}x + b_{n+1}x + b_{n}x + a\label{4} \tag{4}\] \[\text{ For Power: }\ \ y = ax^{b}.\label{5} \tag{5}\]
Comparisons of the predicted results obtained from the use of Modified Regression Approach was made with the observed experimental results at unique check points using simple percentage difference formula;
\[\begin{aligned} \text{Percentage Difference} = \frac{\text{Actual Result} -\text{ Model Result}}{\text{Actual Result}} \times 100\% \end{aligned}\]
The Physio-chemical analysis of the lagoon water used for curing was conducted at Central Research Laboratory, University of Lagos. The lagoon and UNILAG tap water were examined in terms of physio-chemical compositions and are presented in Table 1.
| Parameters |
UNILAG
Tap Water |
UNILAG
Lagoon Water |
WHO
Standard |
BS Standard
[26] |
Nigerian
Standard [27] |
| pH | 6.4 | 7.5 | 6.5-8.5 | 6.5-8.5 | 6.5-8.5 |
| Conductivity \((\mu Scm^-1)\) | 175 | 460 | 750 | – | – |
|
Total dissolved solids
(TDS) (mg/L) |
127 | 2850 | 1000 | 2000 | 500 |
| Chloride (cl) \((mg/L)\) | 67 | 2600 | 250 | 500 | 250 |
| Total hardness \((mg/L)\) | 65 | 520.0 | 100 | – | 150 |
| Calcium (ca) \((mg/L)\) | 46 | 340.0 | – | – | 50 |
| Manganese \((mg/L)\) | 0.34 | 2.33 | 0.5 | – | – |
| Acidity \((mg/L)\) | 13 | 40.0 | – | – | 50 |
| Alkalinity \((mg/L)\) | 21 | 40.0 | 100 | 1000 | 50 |
| Iron (Fe) \((mg/L)\) | 13.56 | 7.25 | 0.3 | – | 0.3 |
| Zinc \((mg/l)\) | 3.85 | 6.45 | 3 | ||
| Lead \((mp/l)\) | 0.11 | 4.56 | 0.01 | ||
| Sulphate \((SO_4^2-) (mg/L)\) | 65 | 614.0 | 250 | 100 | 100 |
| Potassium \((K) (mg/L)\) | 56 | 395.0 | 250 | – | – |
| Chromium \((Cr) (mg/L)\) | 0.01 | 0.02 | 0.05 | – | 0.05 |
| Cadmium \((mg/l)\) | 0.03 | 0.12 | 0.003 | – | 0.003 |
| Phosphate \((PO_4^2-) (mg/L)\) | 0.05 | 0.16 | – | – | – |
| Salinity \((ppm)\) | 72 | 165 | – | – | – |
|
Total Suspended solids
(TSS) \((mg/L)\) |
20 | 60.0 | 1000 | 2000 | – |
| Total solids (TS) \((mg/L)\) | 200 | 10340.0 | 1000 | – | 500 |
| Odour | None | Unobjectionable | – | – | Unobjectionable |
| Colour \((pcu)\) | 179 | 792 | – | – | – |
| Temperature \(^\circ{C}\) | 27.4 | 28.0 | Ambient | Ambient | Ambient |
According to BS 3148 [26], any drinkable water, either treated or untreated for distribution through the public supply, is suitable for making concrete. From Table 1, it is observed that the percentage of chloride content present in the lagoon water was above the tolerable range which could result to a decline in the strength property of the concrete. The pH value was observed to be within the permissible range (6.5-8.5). The Acidity and Alkalinity were 40.0 \(mg/L\), which is acceptable since the standard requirement is 50.0 \(mg/L\). The Total Suspended Solids (TSS) of 60 \(mg/L\) was measured, and found to be lower than the value specified in the BS Standard [26]. Also, the Chromium \((Cr)\) of 0.02 \(mg/L\) was less than the threshold limit of 0.05 \(mg/L\). The combination of calcium, magnesium, iron, sulphate, chloride and potassium values were more than 2000 \(mg/L\) which render the water to be unsuitable for the concrete production (BS 3148: 1980). Also, the high chloride ion content is capable of damaging the protective structure of a concrete matrix, hence leading to reduction in the structural strengths of concrete [28].
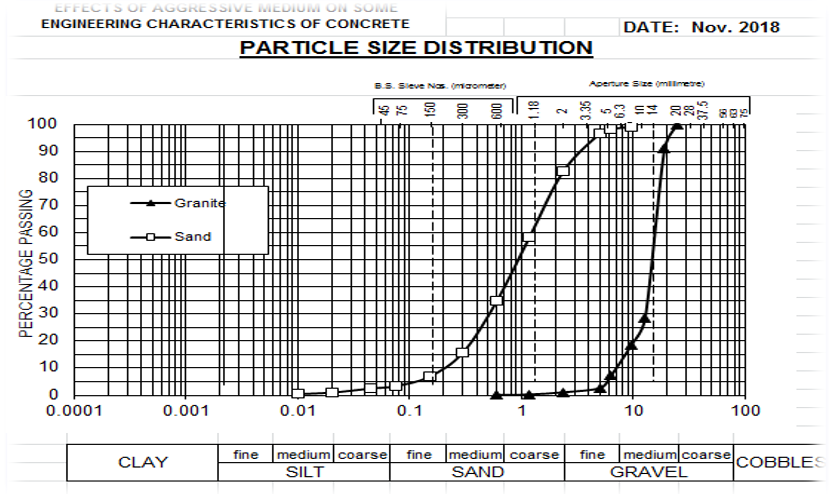
Results of the physical properties test on the concrete constituents used in this study are presented in Table 2.
| Parameters | Granite | Sand | Cement |
| Coefficient of uniformity \((C_u)\) | 1.95 | 6.01 | – |
| Coefficient of Curvature \((C_c)\) | 1.84 | 1.06 | – |
| Fineness modulus | 3.88 | 4.49 | 4.25 |
| Dry Density \((kg/m^3)\) | 1599 | 1524 | 3050 |
| Bulk density \((kg/m^3)\) | 1604 | 1534 | 1297 |
| Specific Gravity | 2.65 | 2.63 | 3.05 |
| Moisture Content \((\%)\) | 0.34 | 0.6 | – |
| Aggregate Crushing Value \((\%)\) | 17.74 | – | – |
| Aggregate Impact Value \((\%)\) | 9.26 | – | – |
According to Unified soil classification system [29,30], the coarse aggregate is classified as poorly graded granite because its coefficient of uniformity \(C_u = \frac{D_{60}}{D_{10}}\) value is less than 4 and Coefficient of Curvature \(C_c = \frac{D_{30} \times D_{30}}{D_{60} \times D_{10}}\) value is between 1-3. The fine aggregate is classified as well graded medium to coarse sand because its \(C_u\) value is greater than 6 and its \(C_c\) value is between 1-3 [29,30]. The densities and specific gravity of the concrete constituents used, met the specified standards of Specific Gravity (2.4-2.9), Bulk Density (1520-1680 \(kg/m^3\)) and are classified as normal weight aggregate according to American Standard Testing Method [31]. The aggregate crushing and impact values of 17.74 and 9.26 respectively for the coarse aggregate were in accordance with the relevant standards [32].
The variations in the compressive strength of concrete due to the influence of different curing medium are presented in Table 3. It is observed from the table that the compressive strength increased with increase in curing age. The reason for the observed trend is that the concrete specimens are subjected to continuous hydration which is responsible for strength gain. Also, the curing conditions help in the prevention of moisture loss needed for continuous hydration.
Although, a decline in strength was noticed for different curing medium and the percentage decrease is as shown in Table 3. The results of concrete specimens cured in Salt Water 2 (SW2) recorded the lowest strength of 28 \(N/mm^2\) at 120 days. Also, decline in strength was observed in both Salt Water 1 (SW1) and Lagoon Water (LW). From the results in Table 3, it was observed that the percentage decrease in strength increased from SW1 to SW2 having a 29.35% decline in strength when compared with the control (potable water) at 28 days.
| Average Compressive Strength \((N/mm^2)\) | ||||||||||||
|
Curing
Medium |
7
Days |
%
Dec. |
14
Days |
%
Dec. |
28
Days |
%
Dec. |
45
Days |
%
Dec. |
90
Days |
%
Dec. |
120
Days |
%
Dec. |
|
PW
(Control) |
18.22 | 0.00 | 26.44 | 0.00 | 29.78 | 0.00 | 32.76 | 0.00 | 36 | 0.00 | 39.63 | 0.00 |
|
Saltwater 1
(SW1) |
17.93 | 1.59 | 24.37 | 7.83 | 29.63 | 0.50 | 32.67 | 0.28 | 35.93 | 0.19 | 39.56 | 0.18 |
|
Lagoon Water
(LW) |
14.51 | 20.36 | 19.56 | 26.02 | 23.85 | 19.91 | 26.22 | 19.96 | 28.82 | 19.94 | 31.7 | 20.01 |
|
Saltwater 2
(SW2) |
12.82 | 29.64 | 17.26 | 34.72 | 21.04 | 29.35 | 23.11 | 29.46 | 25.45 | 29.31 | 28 | 29.35 |
The decline in the compressive strength of concrete cured in salt water 1 (SW1) and salt water 2 (SW2) reveals the effect of chloride concentration on the structural strength integrity of concrete. The differences in concrete strength in the three-curing medium; LW, SW1 and SW2 could be induced to the presence of chloride and the level of chloride content in the curing medium. Thus, increasing the chloride concentration five times (5x) the concentration in lagoon water resulted to an increase in the compressive strength. But a decline in strength was recorded as the chloride content increased beyond five times. From the external environment, the chloride ions penetrated into the concrete matrix causing chemical reaction which weakened the binding capacity or cohesion between the concrete constituents. This could be responsible for the reduction in strength of the concrete.
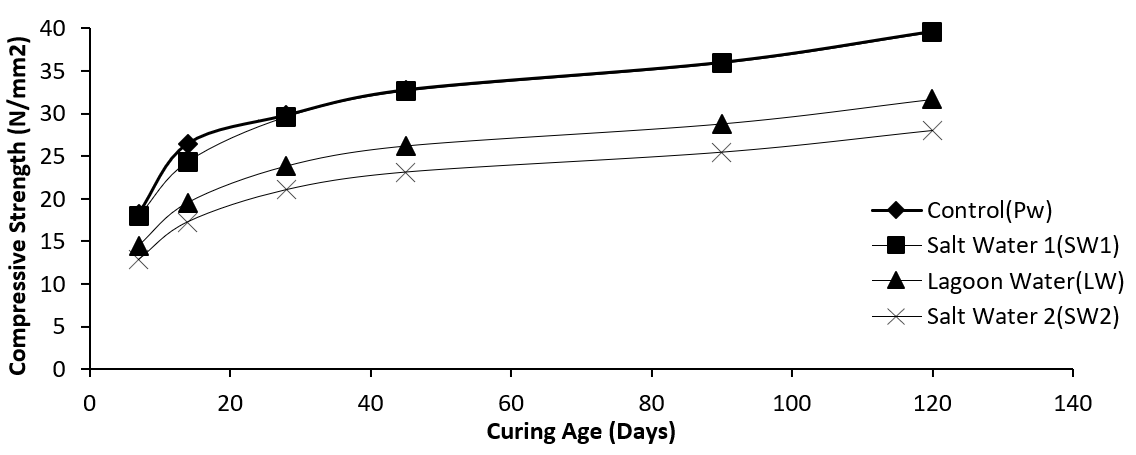
Figure 3 shows that the compressive strength of concrete increased with increase in the curing age. Also, a decline in strength of concrete was observed in different curing medium when compared with the control (potable water). The major cause of the declined strength could be linked to the presence of chlorides, sulphates and other chemicals in the curing medium investigated. High chloride and sulphate contents would lead to chloride and sulphate attacks on the concrete specimens. The ingress of these harmful chemical substances would result in crack formation, bond reduction and lower strength due to the chemical reaction produced from these deleterious chemicals. Similar trends were observed when compared with the past record of findings of previous study [8,32].
The experimental results of split tensile strength of concrete cured in different curing medium are presented in Table 4. The curing age ranges from 7 days to 120 days for the investigation of effect of curing medium on split tensile strength. Also, the different curing medium tends to give insight into how a curing medium could affect the strength development of concrete in marine environment.
| Average Split Tensile Strength \((N/mm^2)\) | ||||||||||||
|
Curing
Medium |
7
Days |
%
Dec. |
14
Days |
%
Dec |
28
Days |
%
Dec. |
45
Days |
%
Dec. |
90
Days |
%
Dec. |
120
Days |
%
Dec. |
|
PW
(Control) |
2.19 | 0.00 | 2.5 | 0.00 | 2.83 | 0.00 | 2.83 | 0.00 | 2.83 | 0.00 | 3.39 | 0.00 |
|
Saltwater 1
(SW1) |
2.12 | 3.196 | 2.24 | 10.400 | 2.43 | 14.134 | 2.43 | 13.419 | 2.43 | 8.709 | 3.11 | 8.260 |
|
Lagoon Water
(LW) |
2.17 | 0.91 | 2.21 | 11.60 | 2.38 | 15.90 | 2.38 | 17.89 | 2.38 | 16.52 | 2.98 | 12.09 |
|
Saltwater 2
(SW2) |
1.98 | 9.59 | 2.02 | 19.20 | 2.33 | 17.67 | 2.33 | 22.36 | 2.33 | 24.92 | 2.57 | 24.19 |
From Table 4, increase in split tensile strength is directly proportional to increase in curing age. This shows the effect of curing age on strength development in concrete. When concrete cylinder spends more time submerged in the curing medium, this leads to an improvement in the pore structure and reduction of the porosity, leading to higher rate of cement hydration and pozzolanic reaction. The split tensile strength of the specimens cured in salt water 2 (SW2) recorded the highest percentage decrease of 24.92% at 90 days as presented in Table 4. Figure 4 depicts the outcome of concrete specimens cured in different curing medium.
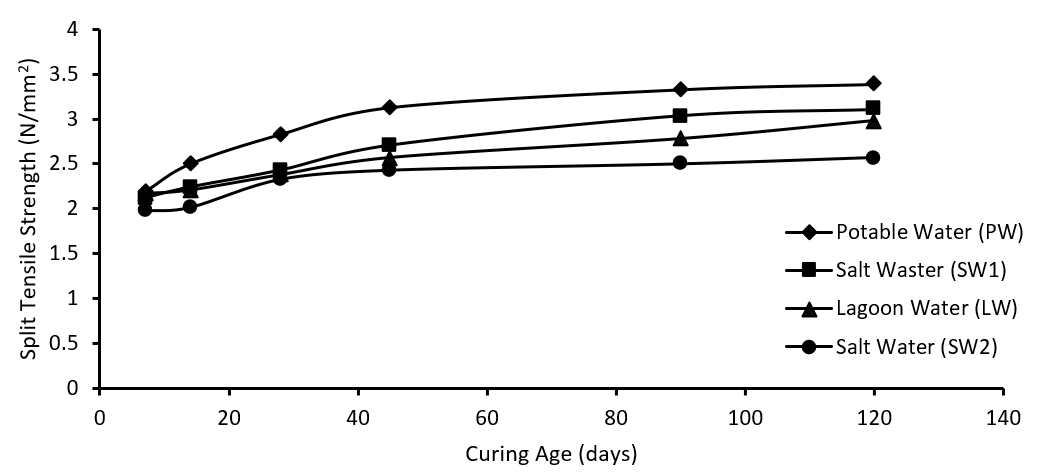
From Figure 4, it is observed that the split tensile strength decreased as the curing medium changes from the potable water (control) to various medium. This can be attributed to the presence of some chemical compounds such as sulphate, chloride, magnesium and calcium, having higher concentration above the allowable specified standards. These generate destructive actions to the cement hydration process which in turn causes deterioration of concrete and leading to strength loss. Also, since the reaction of water and cement in concrete creates hydration reaction which produces calcium silicates that is responsible for strength development, the harmful chemical compounds in this curing medium attack the calcium silicates by reducing its impact on the concrete.
Generally, the results of the split tensile strength are about 10% of its compressive strength which reveals that concrete is strong in compressive but weak in tension as a result to its brittle nature.
The results recorded from the experimental investigation on the flexural strength of concrete cured in different medium are presented in Table 5. The results reveal the capacity of unreinforced concrete beams to withstand load in bending and the impact of different curing medium on its flexural performance.
| Average Flexural Strength \((N/mm^2)\) | ||||||||
|
Curing
Medium |
28 Days | % Dec. | 45 Days | % Dec. | 90 Days | % Dec. | 120 Days | % Dec. |
|
Potable Water
(PW) |
6.33 | 0.00 | 6.88 | 0.00 | 7.60 | 0.00 | 8.20 | 0.00 |
|
Salt water I
(SW1) |
5.60 | 11.53 | 5.67 | 17.59 | 6.14 | 19.21 | 6.77 | 17.44 |
|
Lagoon Water
(LW) |
4.87 | 23.06 | 5.20 | 24.42 | 5.94 | 21.84 | 6.60 | 19.51 |
|
Salt water II
(SW2) |
4.20 | 33.65 | 4.55 | 33.87 | 5.00 | 34.21 | 5.60 | 31.71 |
Increase in curing age results in improved pore structure and lower porosity which also increased the flexural strength of the concrete. A decline was noticed for the specimens cured in SW1, LW and SW2 when compared with the ones cured in PW (control). As presented in Table 5, the specimens cured in SW2 recorded the highest percentage decrease in flexural strength. This could be attributed to the chloride and sulphate concentration in the curing medium.
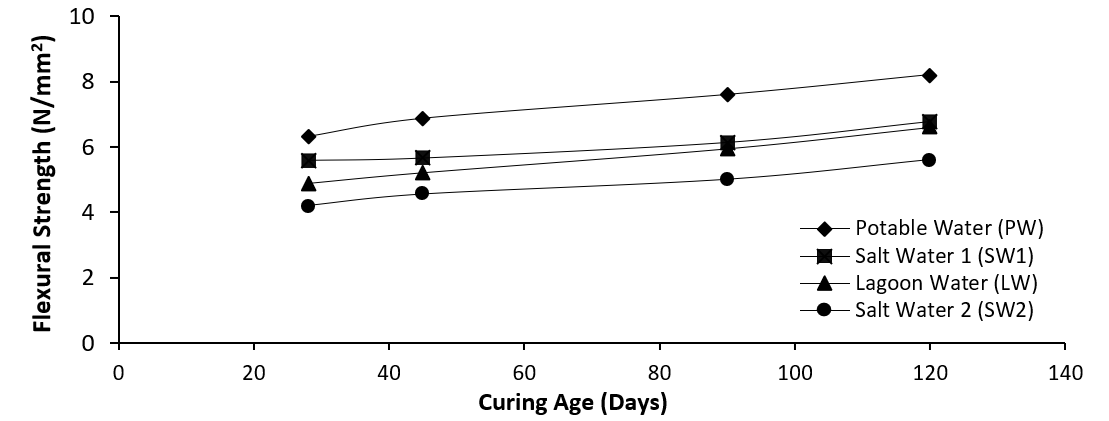
The figure also shows the impact of curing medium on the flexural strength of concrete. It shows that flexural strength increases as curing age increased, but decreased for each curing medium compared to the control. This is because the applied load is exerted on the unreinforced concrete beam, deflection starts to occur as a result of the stresses being transferred from the outer surface to the microstructure of the concrete matrix which can only resist the stress with its internal stress built-up resistance capacity which is highly limited. Since, some chemical compounds of higher concentration present in the curing medium, weaken the pore structure of the concrete matrix, this results in lower stress resistance and leads to early failure of concrete when loaded in flexure. Furthermore, it was noted that the flexural strength was about 20 percent of the compressive strength of the specimens.
Predictive models were developed using Modified Regression Approach in which base process involves the modification of Regression Method by introduction of a variable into the base model equation in order to estimate the structural strengths of concrete cured in diverse curing medium.
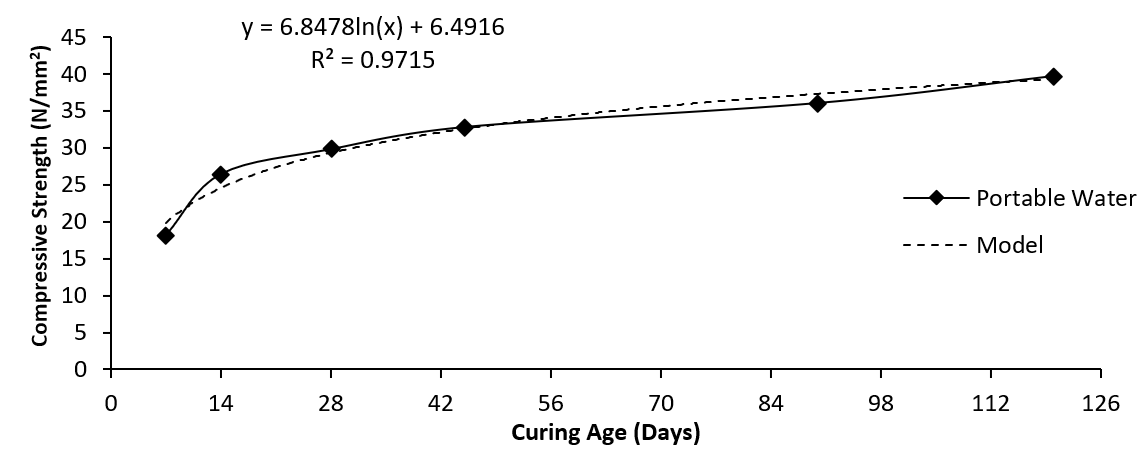
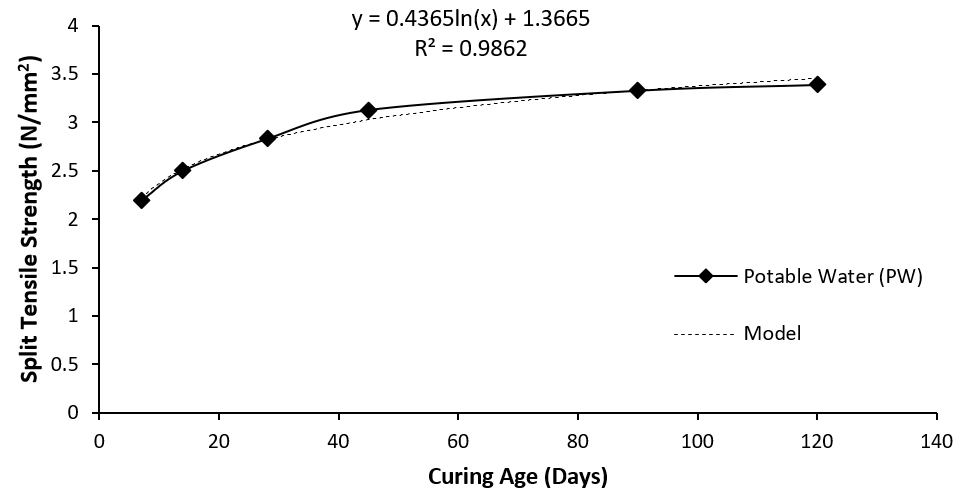
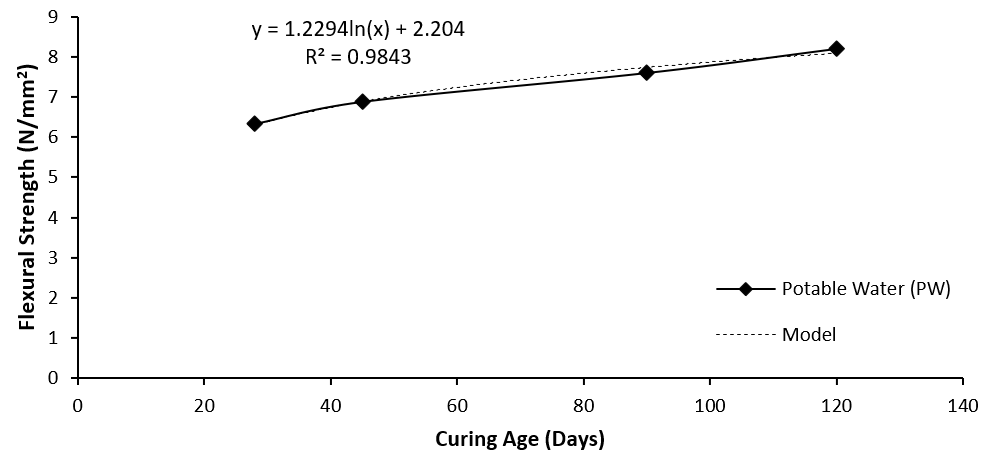
From the Regression method, a logarithmic function was selected based on the condition of behavioral pattern of the experimental data and its R-squared value. The base models are: \[\ F_{cu} = (6.8478 \ In(D) + 6.4916),\label{6} \tag{6}\] \[ F_{y} = (0.4365 \ In(D) + 1.3665),\label{7} \tag{7}\] \[ F_{f} = (1.2294 \ In(D) + 2.204),\label{8} \tag{8}\] where \(F_{cu}=\) Compressive Strength of Concrete, \(F_{y} =\) Tensile Strength of Concrete, \(F_{f} =\) Flexural Strength of Concrete.
As shown in Figures 6, 7 and 8, the \(R\) squared value obtained using logarithmic function are 0.9715, 0.9862 and 0.9843 for compressive, tensile and flexural strength functions respectively. This indicates that the mathematical models explain closely all the variability of the response data around its mean.
From the modified regression approach, Equations (6), (7) and (8) were generated having a curing medium factor variable \((\alpha)\) introduced into the Equations (1)- (5), and are then presented as
\[\begin{aligned} F_{cu} &=& \alpha (6.8478 \ In(D) + 6.4916),\\ F_{y} &=& \alpha (0.4365 \ In(D) + 1.3665),\\ F_{y} &=& \alpha (0.4365 \ In(D) + 1.3665). \end{aligned}\]
The curing medium factors are derived and presented in Tables 6, 7 and 8 for compressive, tensile and flexural strengths respectively. The factors were generated by dividing the various curing medium by the control (PW).
|
Curing
Medium Ratio |
7 Days | 14 Days | 28 Days | 45 Days | 90 Days | 120 Days |
| PW | 1 | 1 | 1 | 1 | 1 | 1 |
| SW1/PW | 0.984 | 0.922 | 0.995 | 0.997 | 0.998 | 0.998 |
| LW/PW | 0.796 | 0.740 | 0.801 | 0.800 | 0.801 | 0.800 |
| SW2/PW | 0.704 | 0.653 | 0.707 | 0.705 | 0.707 | 0.707 |
|
Curing
Medium Ratio |
7 Days | 14 Days | 28 Days | 45 Days | 90 Days | 120 Days |
| PW | 1 | 1 | 1 | 1 | 1 | 1 |
| SW1/PW | 0.968 | 0.896 | 0.859 | 0.866 | 0.913 | 0.917 |
| LW/PW | 0.991 | 0.884 | 0.841 | 0.821 | 0.835 | 0.879 |
| SW2/PW | 0.904 | 0.808 | 0.823 | 0.776 | 0.751 | 0.758 |
|
Curing
Medium Ratio |
28 Days | 45 Days | 90 Days | 120 Days |
| PW | 1 | 1 | 1 | 1 |
| SW1/PW | 0.885 | 0.824 | 0.808 | 0.826 |
| LW/PW | 0.769 | 0.756 | 0.782 | 0.805 |
| SW2/PW | 0.664 | 0.661 | 0.658 | 0.683 |
|
Curing
Age (Days) |
Potable Water | Salt water 1 | Lagoon Water | Salt water 2 | ||||||||
| Exp. | Pred. |
Perc.
Diff. |
Exp. | Pred. |
Perc.
Diff. |
Exp. | Pred. |
Perc.
Diff. |
Exp. | Pred. |
Perc.
Diff. |
|
| 7 | 18.22 | 19.81 | 8.03 | 17.93 | 19.50 | 8.05 | 14.51 | 15.85 | 8.45 | 12.82 | 13.87 | 7.57 |
| 14 | 26.44 | 24.56 | -7.65 | 24.37 | 22.65 | -7.59 | 19.56 | 18.18 | -7.59 | 17.26 | 15.97 | -8.08 |
| 28 | 29.78 | 29.31 | -1.60 | 29.63 | 29.16 | -1.61 | 23.85 | 23.44 | -1.75 | 21.04 | 20.72 | -1.54 |
| 45 | 32.37 | 32.56 | 0.58 | 32.67 | 32.46 | -0.65 | 26.22 | 26.05 | -0.65 | 23.11 | 22.95 | -0.70 |
| 90 | 36.00 | 37.31 | 3.51 | 35.93 | 37.23 | 3.49 | 28.82 | 29.84 | 3.42 | 25.45 | 26.37 | 3.49 |
| 120 | 39.63 | 39.28 | -0.89 | 39.56 | 39.20 | -0.92 | 31.70 | 31.42 | -0.89 | 28.00 | 27.77 | -0.83 |
|
Curing
Age (Days) |
Potable Water | Salt water 1 | Lagoon Water | Salt water 2 | ||||||||
| Exp. | Pred. |
Perc.
Diff. |
Exp. | Pred. |
Perc.
Diff. |
Exp. | Pred. |
Perc.
Diff. |
Exp. | Pred. |
Perc.
Diff. |
|
| 7 | 2.19 | 2.21 | 0.90 | 2.12 | 2.15 | 1.40 | 2.17 | 2.20 | 1.36 | 1.98 | 2.00 | 2.19 |
| 14 | 2.50 | 2.52 | 0.79 | 2.24 | 2.26 | 0.88 | 2.21 | 2.23 | 0.90 | 2.02 | 2.23 | 2.50 |
| 28 | 2.83 | 2.82 | -0.35 | 2.43 | 2.42 | -0.41 | 2.38 | 2.37 | -0.42 | 2.33 | 2.32 | 2.83 |
| 45 | 3.13 | 3.03 | -3.30 | 2.71 | 2.62 | -3.44 | 2.57 | 2.49 | -3.21 | 2.43 | 2.35 | 3.13 |
| 90 | 3.33 | 3.33 | 0.00 | 3.04 | 3.04 | 0.00 | 2.78 | 2.78 | 0.00 | 2.50 | 2.50 | 3.33 |
| 120 | 3.39 | 3.46 | 2.02 | 3.11 | 3.17 | 1.89 | 2.98 | 3.04 | 1.97 | 2.57 | 2.62 | 3.39 |
|
Curing
Age (Days) |
Potable Water | Salt water 1 | Lagoon Water | Salt water 2 | ||||||||
| Exp. | Pred. |
Perc.
Diff. |
Exp. | Pred. |
Perc.
Diff. |
Exp. | Pred. |
Perc.
Diff. |
Exp. | Pred. |
Perc.
Diff. |
|
| 28 | 6.33 | 6.30 | -0.48 | 5.60 | 5.58 | -0.36 | 4.87 | 4.85 | -0.41 | 4.20 | 4.18 | -0.48 |
| 45 | 6.88 | 6.88 | 0.00 | 5.67 | 5.67 | 0.00 | 5.20 | 5.20 | 0.00 | 4.55 | 4.55 | 0.00 |
| 90 | 7.60 | 7.74 | 1.81 | 6.14 | 6.25 | 1.76 | 5.94 | 6.05 | 1.82 | 5.00 | 5.09 | 1.77 |
| 120 | 8.20 | 8.09 | -1.36 | 6.77 | 6.68 | -1.35 | 6.60 | 6.51 | -1.38 | 5.60 | 5.53 | -1.27 |
It is observed from the results in Tables 9, 10 and 11 that the strengths are directly proportional to the curing ages and curing medium, i.e, as the curing age increased, the compressive, tensile and flexural strengths increased. From the analysis, it was noted that the percentage differences between experimental data and the predicted values were within \(\pm\)8%, \(\pm\)3% and \(\pm\)2% for compressive, tensile and flexural strengths. These give good confidence level of 92%, 97% and 98% respectively. Therefore, these models could be used to estimate the value of structural strengths of concrete cured in various curing medium.
In this study, the impact of different curing medium on the structural strength characteristics of concrete were investigated. The following conclusions are drawn:
The combination of some compounds like calcium, magnesium, iron, sulphate, chloride and potassium values which were more than 2000 \(mg/L\) in the lagoon water rendered it not suitable for concrete curing. The high concentrations of these substances resulted in the reduction of structural strengths of concrete.
Increase in the curing age resulted in increase in the structural strengths (Compressive, split tensile and flexural strengths) of concrete irrespective of the curing medium. The increase in the concentrations of chloride contents led to increase in the structural strengths of concrete cured in salt water I; but further increase resulted in a lower strength parameter for samples cured in salt water II.
The decline in strengths were as a result of the high concentrations of chloride, sulphate and magnesium contents found in the curing medium (lagoon water, salt water I and II).
Models for predicting the structural strengths of concrete cured in different curing medium were developed through modified regression approach and found to be in good agreement with the experimental data with high level of significance.
In the construction industry, there is need for adequate factor of safety to mitigate against early strength loss as a result of the presence of high-level pollutants in the surrounding water bodies especially areas like Makoko, Lekki, Ajah axis of Lagos state, Nigeria, West Region of Africa. The outcome reveals that the usage of normal concrete in an aggressive environment, there is likelihood of reasonable loss of the expected strength of the concrete. Therefore, the durability of structure will be negatively affected in coastal areas. So, there is need for adequate research on the effect of coastal water on the short- and long-term strength of normal concrete in construction.
Regulatory agencies and governing society of engineers are advised to mandate their structural engineering members to modify the concrete covers used in designing the foundation of concrete structures based on the rate of exposure to aggressive environment in other to lower the impact of some factors such as chloride, sulphate, acid attacks that affect the service life of concrete. Also, adequate test on the quality of ground water should be carried out in order to determine the concentration of harmful chemical compounds present in the water.
The present study reveals the factors that could be responsible for the decline in structural strengths of concrete cured in the various curing media investigated. However, the salt water solution simulation in the laboratory does not fully replicate the aggressiveness of actual marine water (environment). It is hoped that the study provided an insight into the behaviour of shoreline concrete structures cured in aggressive medium and having to remain in such medium throughout their service life span.