In this study, a mathematical model of dual latency compartments is developed to investigate the transmission dynamics of COVID-19 epidemic in Oyo state, Nigeria. The model consists of non-pharmaceutical control strategies which include the use of face masks, social-distancing and impact of mass-media on the spread of novel coronavirus in the state. Results indicate control reproduction number \(R_C = 1.4\) with possibilities of high constructive influence of mass-media. Thus, at the fitted values of \(\sigma _f = 0.1,\; \sigma _d = 0.1,\;\sigma _m = 0.6\), the peak of the COVID-19 epidemic is attained after 59,217 infectious quarantined individuals and 328,440 infectious but not quarantined individuals have contracted COVID-19 in about 439 and 443 days respectively from the date of the first incidence. Therefore, efforts on mass-media with programs that can inform the people on effective use of face masks, social-distancing and other safety measures can aid reduction of reproduction number to a value below 1 necessary for eradication of the disease.
Severe Acute Respiratory Syndrome Coronavirus 2 (SARS-CoV-2) is the virus strain of COVID-19 which emerged from Wuhan city of China and has spread to Nigeria which is the most populous country in Africa with an estimated population of about 200 million people [1]. The first case of the novel coronavirus was discovered in Nigeria on February 27, 2020 as reported by the Nigeria Centre for Disease Control (NCDC). There are thirty six states in Nigeria and one Federal Capital Territory (FCT). Oyo state is one of the thirty six states with an estimated population of about 7,840,864 as at the year 2016 [2] and its first COVID-19 case was discovered on March 22, 2020. Since the discovery of its first case, there has been increase in the spread of the COVID-19 among the people. This spread has continued despite the proactive measures taken by the policymakers such as creation of isolation centres for the purpose of separating infectious individuals from other susceptible individuals by putting them in quarantine.
Other government interventions to curb the spread of infections include announcement of dusk to dawn curfew ranging between 7 PM and 6 AM local time, banning of interstate travel from and into Oyo state, except vehicles carrying food items and other essential commodities as well as closure of all schools and markets except those selling perishable food items [3,4]. Ban on all social gatherings including religious services, burials, birthday parties and weddings was also imposed on March 23, 2020 [5]. However, as part of strategies to open the economy of the state, the initially imposed curfew was relaxed to range between 8 PM and 5 AM and schools within the state were ordered to open on July 6, 2020 to students at the final year of their studies only [6].
Some researches on COVID-19 epidemic have been conducted which are country or location specific [7,8,9,10,11]. Others are based on the peculiar nature of the novel coronavirus itself, its incubation period, mode of transmission, risk, estimation of its parameters for dynamic modelling, persistence on inanimate surfaces and inactivation with biocidal agents [12,13,14,15]. While considering Nigeria in their study, the research of [16] on Nigeria centred on Lagos, Kano and FCT, they did not investigate infection transmission dynamics of COVID -19 in Oyo state. Also, the study conducted by [17] examined the impact of non-pharmaceutical control measures on the population dynamics of Lagos state, Nigeria using a formulated model. However, their work solely centred on Lagos state in Nigeria being the state having the highest number of detected COVID-19 cases in the country; they also did not consider Oyo state. None of the researches to date in literature has considered the dynamics of the spread of COVID-19 in Oyo state, Nigeria using dual latency compartments approach.
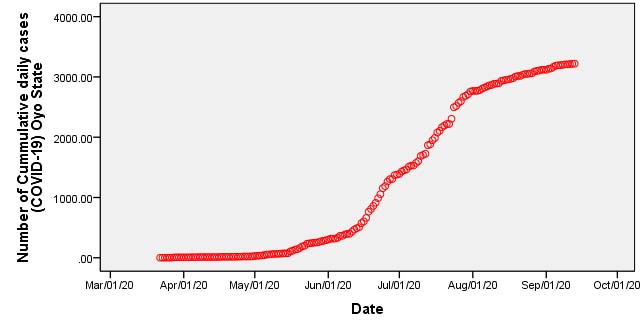
The motivation to embark on this study stems from the fact that Oyo state is in the third position among states in Nigeria with the highest number of COVID-19 cases according to the data obtained from NCDC on September 13, 2020. This could probably be due to its close proximity to Lagos state which is regarded as the epicentre of the COVID-19 in Nigeria. It was also observed that Lagos and Oyo states have been sending large samples for laboratory test for COVID-19. While Lagos has sent 104,532 samples, Oyo state has sent 21,154 samples for laboratory test for COVID-19 as at September 8, 2020; hence they are among the first five states which have sent large samples to laboratories for COVID-19 test as part of their determination to curb the spread of the novel coronavirus. Thus, it will be beneficial to investigate the impact of the non-pharmaceutical interventions on the transmission dynamics of COVID-19 in Oyo state, Nigeria.
In this study, we develop a mathematical model of dual latency compartments to examine effects of non-pharmaceutical control measures on the spread of COVID-19 in Oyo state, Nigeria. The choice of non-pharmaceutical control measures such as the use of face masks, social distancing and the use of mass media is imperative since there has not been any approved vaccine against COVID-19 in Nigeria.
The remaining part of this study is organised as follows: Section 2 centres on methodology, Section 3 deals with qualitative analysis of the developed model, while Section 4 presents results and discussion and finally conclusion comes up in Section 5.
The model formulation is based on community transmission of the virus among human population. An assumption of dual latency compartments is made based on the work of who reported the possibility of transmission of novel coronavirus during incubation period and in pre-symptomatic cases. The human community is divided into six compartments: Susceptible community \(S_c (t)\), Exposed not yet infectious community \(E_1 (t)\) (First latency stage), Exposed infectious community \(E_2 (t)\) (Second latency stage), Infectious (not detected, not quarantined symptomatic and asymptomatic) community \(I_1 (t)\), Infectious (detected, quarantined symptomatic and asymptomatic) community \(I_2 (t)\) and Recovered \(R(t)\). The total human population is denoted by \(N(t)\) so that \(N(t) = S_c (t) + E_1 (t) + E_2 (t) + I_1 (t) + I_2 (t) + R(t)\). The flow diagram of the model is given in Figure 2.
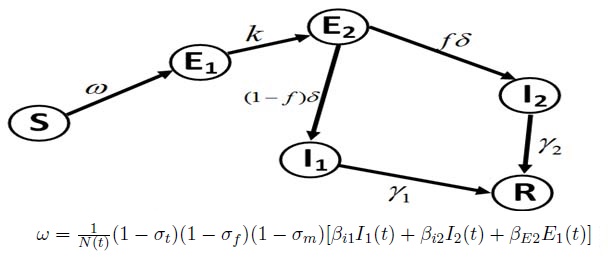
Since this is an epidemic model, the system governing the evolution of the homogeneously distributed community of people for compartments described in Figure 2 is based on short time scale of few months [17]. Thus, an assumption that births and natural deaths do not play a significant role within the specified period is made hence births and natural deaths are not included except deaths from the disease by removal from infectious compartments which is captured in compartment \(R(t)\) [18,19]. The model is governed by the following nonlinear ordinary differential equations;
| State variable | Description |
|---|---|
| S | Susceptible community |
| \(E_1 \) | Exposed not yet infectious community (First latency stage) |
| \(E_2 \) | Exposed and infectious community (not detected, second latency stage) |
| \(I_1 \) | Infectious (not detected, not quarantined symptomatic and asymptomatic) community |
| \(I_2 \) | Infectious (detected, quarantined symptomatic and asymptomatic) community |
| R | Recovered |
| State variable | Description |
|---|---|
| \(\beta _{E_2 } ,\beta _{I_1 } ,\beta _{I2} \) | Transmission rate among exposed infectious, infectious (undetected, not quarantined) |
| and infectious (detected, quarantined) communities. | |
| \(\sigma _f ,\sigma _d ,\sigma _m \) | Proportion of people that use face masks, practice social distancing and |
| transmission rate of awareness through mass media influence | |
| \(f\) | Fraction of exposed, infectious community that becomes infectious |
| (detected, quarantined) community \(I_2 \). | |
| \(1 – f\) | Fraction of exposed, infectious community that becomes infectious |
| (undetected, not quarantined) community \(I_1 \). | |
| \(\delta \) | Rate of progression of exposed, infectious community to |
| fully infectious communities \(I_1 ,I_2 \) | |
| \(\gamma _1 ,\gamma _2 \) | Recovery rates from infectious (undetected, not quarantined) community \(I_1 \) and |
| infectious (detected, quarantined) community \(I_2 \) | |
| k | Rate of progression from exposed non infectious |
| community to exposed infectious community. |
The recovery period of infected individuals ranges between 3 and 30 days, in this study we made an assumption of average recovery period of 15 days for detected, quarantined symptomatic and asymptomatic community so that \(\gamma _2 = \frac{1}{{15}}\) and average recovery period of 20 days for undetected, not quarantined symptomatic and asymptomatic community so that \(\gamma _1 = \frac{1}{{20}}\). The former is based on the assumption that the detected, quarantined community receive special care such as being treated with certain antibiotics and some multivitamins which have potency to boost immune system of infected individuals towards faster recovery than the latter case, hence \(\gamma _1 = 0.05\), \(\gamma _2 = 0.067\).
The parameter for the use of face masks \(\sigma _f \) and variations of its values for this study is centred on and around the values obtained for it in [23] The values associated with the use of face masks \(\sigma _f \) is assumed very low due to large observable population of people not adhering strictly to its use and also due to its improper use or low quality stuffs available among the population. Other non-pharmaceutical control strategies such as social distancing \(\sigma _d \), use of mass media \(\sigma _m \) and disease transmission rates \(\beta _{I1} ,\beta _{I2} \), \(\beta _{E2} \) and \(\delta \) as well as some initial conditions of the model (3) are fitted to the cumulative daily COVID-19 cases from NCDC data using nonlinear least squares technique with the aid of Maple software. Since the total population of Oyo state is estimated as N(t)=7,840,864 and the first COVID-19 case was announced on March 22, 2020, the initial conditions are set as S(0) = 7,838,864, \(R(0) = 0, I_2 (0) = 1\) with \(E_1 (0),E_2 (0),I_1 (0)\) estimated from cumulative daily COVID-19 data obtained from NCDC. The values of the parameters used for this study are shown in Table 3. It should be emphasized that the reported number of COVID-19 cases in Oyo state came from very small number of laboratory tests carried out, thus there is likelihood of NCDC reporting below the actual COVID-19 cases within the population. Also, the choice of high initial parameter value in nonlinear least squares method for mass media is based on the assumption of aggressive broadcast and awareness campaign of the Oyo state government with consequent inducement of the fear of the disease [24].
| Parameter | Default values | Ref |
|---|---|---|
| \(\beta _{I_1 } \) | 0.15 | Data Fitted |
| \(\beta _{I2} \) | 0.4 | Data Fitted |
| \(\beta _{E2} \) | 0.3 | Data Fitted |
| \(\sigma _f = \sigma _d \) | 0.1 | Eikenberry \emph{et al.,} [23] / Data Fitted |
| \(\sigma _m \) | 0.6 | Data Fitted |
| \( f \) | 0.1923 | Rothan and Byrareddy [21] |
| \(\delta \) | 0.35 | Data Fitted |
| \(\gamma _1 \) | 0.05 | Assumed |
| \(\gamma _2 \) | 0.067 | Chen et al., [22] |
| \( k \) | 0.5 | Data Fitted |
| \( E1(0) \) | 40 | Data Fitted |
| \( E2(0) \) | 70 | Data Fitted |
| \( I1(0) \) | 50 | Data Fitted |
| \( I2(0) \) | 1 | Data Fitted |
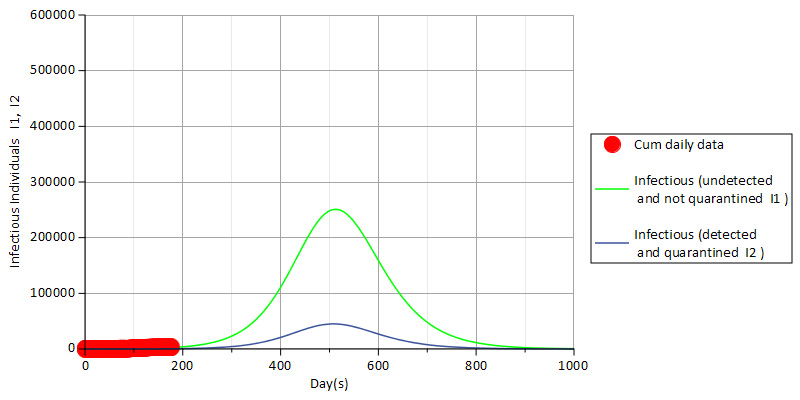
In this section, we carry out numerical simulations of the model (3) whose equations are solved numerically using Maple software. The target of the numerical simulations is towards investigating the effects of non-pharmaceutical control strategies such as the use of face masks, social distancing and mass media effects on the transmission of COVID-19 epidemic in Oyo state, Nigeria. The results from Figure 3 compare the actual data of cumulative daily COVID-19 infectious individuals (red) with simulations of infectious, undetected, not quarantined individuals \(I_1 (t)\) (green) and infectious, detected, quarantined individuals \(I_2 (t)\) (blue) in Oyo state, Nigeria.

The graphical display of Figure 3 indicates that the model (3) is well fitted to the actual data and that the peak of the COVID-19 epidemic will be attained in about 350 days for parameters \(\sigma _f = 0.01,\ \sigma _d = 0.1,\ \sigma _m = 0.6\). This means that when level of compliance of Oyo state residents with the use of face masks and social distancing is very low compared with high usage of mass media, there is a tendency to attain the peak of the epidemic in about 350 days after about 491,891 people and 89,388 people have become infectious both from the group of infectious, undetected, not quarantined individuals \(I_1 (t)\) (green) and the group of infectious, detected, quarantined individuals \(I_2 (t)\)(blue) respectively in Oyo state, Nigeria.
Figure 4 indicates that with \(\sigma _f = 0.05,\sigma _d = 0.1,\sigma _m = 0.6\), there is a shift of the peak of COVID-19 infections towards the right between 350 days and 400 days with about 418,638 and 75,807 infectious individuals in compartments \(I_1 (t)\) and \(I_2 (t)\) at peak of the epidemic. This means that with a slight increase from 0.01 to 0.05 representing about \(5% \) increase in the use of face masks with low social distancing but high mass media effect, there could be reduction in the population of infectious individuals to 418,638 and 75,807 against 491,891 and 89,388 people observed at the peak in Figure 3 for both groups of infectious, quarantined people and those who are infectious but not quarantined. It should be noted that in the nonlinear least squares method, the value of \(\sigma _f \) is fitted with low initial value of parameter for face masks usage due to observable low compliance of people towards its use and due to low enforcement of its usage by law enforcement agencies. Evidence of the contributions of face masks usage is further displayed in Figure 5 with the value of \(\sigma _f \) set to 0.1 indicating a further \(5% \) increase from the value used in Figure 4. Some further shift in the peak of the infection rate of the COVID-19 cases is observed but with reduction in the number of individuals that might have acquired fully infectious status. This means that with \(\sigma _f = 0.1\), about 328,440 and 59,217 individuals from fully infectious compartments \(I_1 ,I_2 \) would have contracted the disease and become infectious at about 347 days starting from the date of its first incidence which is March 22, 2020.


Mass media effect on the population of people in Oyo state is also investigated as shown in Figures 6,7 and 8. Results from Figure 6 show possibility of attaining the peak of the epidemic between 300 days and 350 days after about 533,530 and 97,147 have contracted the coronavirus for both groups of infectious undetected, not quarantined individuals and infectious detected, quarantined individuals for parameter values \(\sigma _m = 0.55,\ \sigma _f = 0.1,\ \sigma _d = 0.1\). However, a slight increase to about \( 60% \) in the mass media effects as shown in Figure 7 suggests a decrease to about 328,440 and 59,217 at the peak of the COVID-19 disease incidence when compared with Figure 6.


Further increase in the value of the parameter for mass media to about \( 62% \) of the population as shown in Figure 8 also indicate further shift in the peak to the right with possibility of population of infected individuals dropping to about 250,146 and 44,940 individuals respectively for infectious undetected, not quarantined individuals and infectious detected, quarantined individuals respectively.
Though not indicated here, investigation on social distancing for values of \(\sigma _d = 0.01,\ \sigma _d = 0.05,\ \sigma _d = 0.1\) also showed a shift in the peak of the COVID-19 disease incidence to the right similar to what is shown in Figures 3,4 and 5. It should be noted that the values of parameters used for social distancing are based on similar assumptions for the use of face masks as the model (3) is fitted to data obtained from NCDC. The low values of parameters for the simulation of the social distancing are based on the assumption that quite a large observable number of people especially in the market places and some other areas of social gatherings do not observe the prescribed social distancing. Thus, while fitting the model of this study to data, initial value representing social distancing for fitting the model was set low in the nonlinear least squares method.
Although Figures 9 and 10 only show effects of social distancing for various values \(\sigma _d = 0.01,\ \sigma _d = 0.05,\ \sigma _d = 0.1\), similar effects of shift in peaks of incidence rates of COVID-19 are observed in the variations of the values of social distancing for the first and second latency compartments of exposed individuals. This means that enforcement of these non-pharmaceutical measures at higher values could significantly reduce the spread of COVID-19 epidemic for the exposed individuals in the latency compartments in Oyo state, Nigeria.

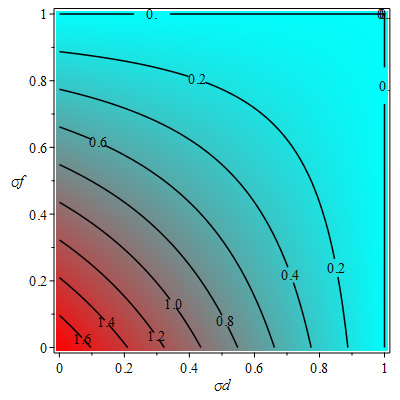
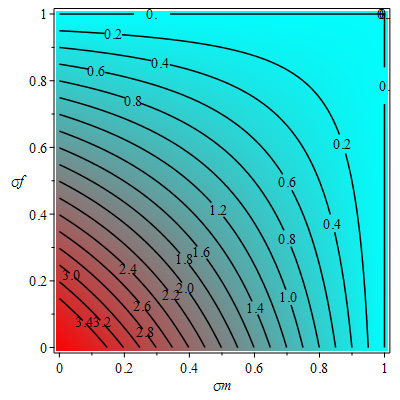
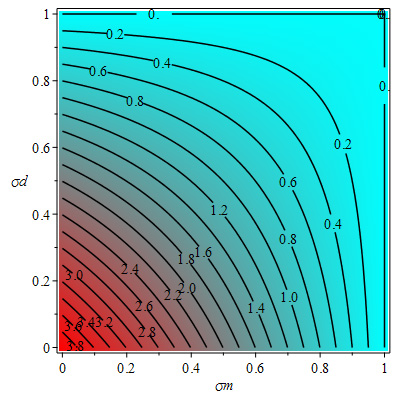
Generally, control reproduction number \(R_C \) below the value of 1 is required for the elimination of the pandemic but using values of Table 3 gives \(R_C = 1.4\) . The contour plots shown in Figures 11, 12 and 13 also indicate that the control reproduction number is greater than 1 at the baseline values \(\sigma _f = 0.1,\sigma _d = 0.1,\sigma _m = 0.6\) of face masks, social distancing and mass media. Figure 11 shows that about \( 50% \) in the use of face masks and about \( 45% \) social distancing with a baseline value of 0.6 of mass media could guarantee control reproduction number lower than 1. Figure 12 indicates that at baseline value 0.1 of social distancing as in Table 3, about \( 45% \) use of face masks and about \( 80% \) use of mass media, there can also be control reproduction number less than 1. Furthermore, for about \( 55% \) social distancing and about \( 80% \) of mass media, there is possibility of control reproduction number being below 1 for baseline value 0.1 of the use of face masks as shown in Figure 13.

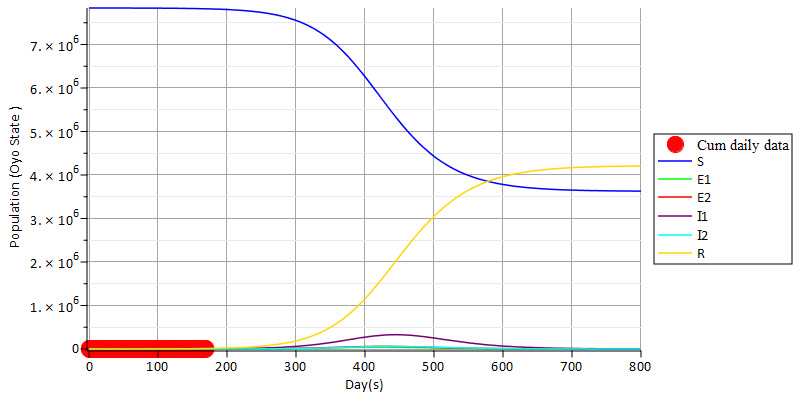
Results in Figure 14 shows \(SE_1 E_2 I_1 I_2 R\) model which indicate that the population of susceptible individuals \(S(t)\) reduces and the population of the recovered \(R(t)\) increases before attaining equilibrium state.
https://dailypost.ng/2020/03/21/covid-19-makinde-orders-closure-of-schools-in-oyo-inaugurates-emergency-centres.
https://thenationonlineng.net/makinde-bans-gathering-of-more-than-30-persons-over-covid-19.
https://www.premiumtimesng.com/regional/ssouth-west/394420-coronavirus-makinde-reviews-curfew-in-oyo.html.
https://www.medrxiv.org/content/10.1101/2020.05.22.20110387v2.article-info. [Google Scholor]