
Transportation serves as an essential catalyst for social, economic, strategic, and political development within any society. For urban centers to function effectively, they require basic infrastructure-with transportation being among the most vital components [1-3]. Well-developed transportation infrastructure ensures the safe, timely, cost-effective, and environmentally sustainable movement of both people and goods [4,5]. Additionally, strategic improvements integrate and streamline various transportation modes for enhanced socioeconomic outcomes and security [6]. A sustainable transportation system, characterized by safety, reliability, efficiency, and environmental consciousness, is crucial to maximizing the benefits of developed infrastructure [7]. Within the North-central states of Abuja, Nasarawa, and Niger, addressing the challenges of inner-city congestion is integral to their continued progress [8,9].
North-central Nigeria, also known as the Middle Belt, is a transitional region stretching longitudinally across central Nigeria and serving as a bridge between the country’s northern and southern zones. It comprises the southern portion of the former Northern Region of Nigeria [10,11] and lacks a single dominant ethnic group. Additionally, it houses Nigeria’s Federal Capital Territory (FCT). States within this region include Niger, former Plateau (now Plateau and Nasarawa), Kogi, former Gongola (now Adamawa and Taraba), Kwara, Benue, and the FCT. Notably, while portions of southern Yobe, Kaduna, Gombe, Bauchi, Kebbi, and Borno states share ethnic ties with the Middle Belt, they lie outside its core. The Middle Belt had an approximate population of 17.3 million in 1991 [12], estimated to exceed 45 million today. Religiously, the region has a majority Christian population (65%), followed by Animist (10%) and Muslim (25%) populations. Culturally, it boasts a rich linguistic diversity with over 230 languages and dialects [10,11].
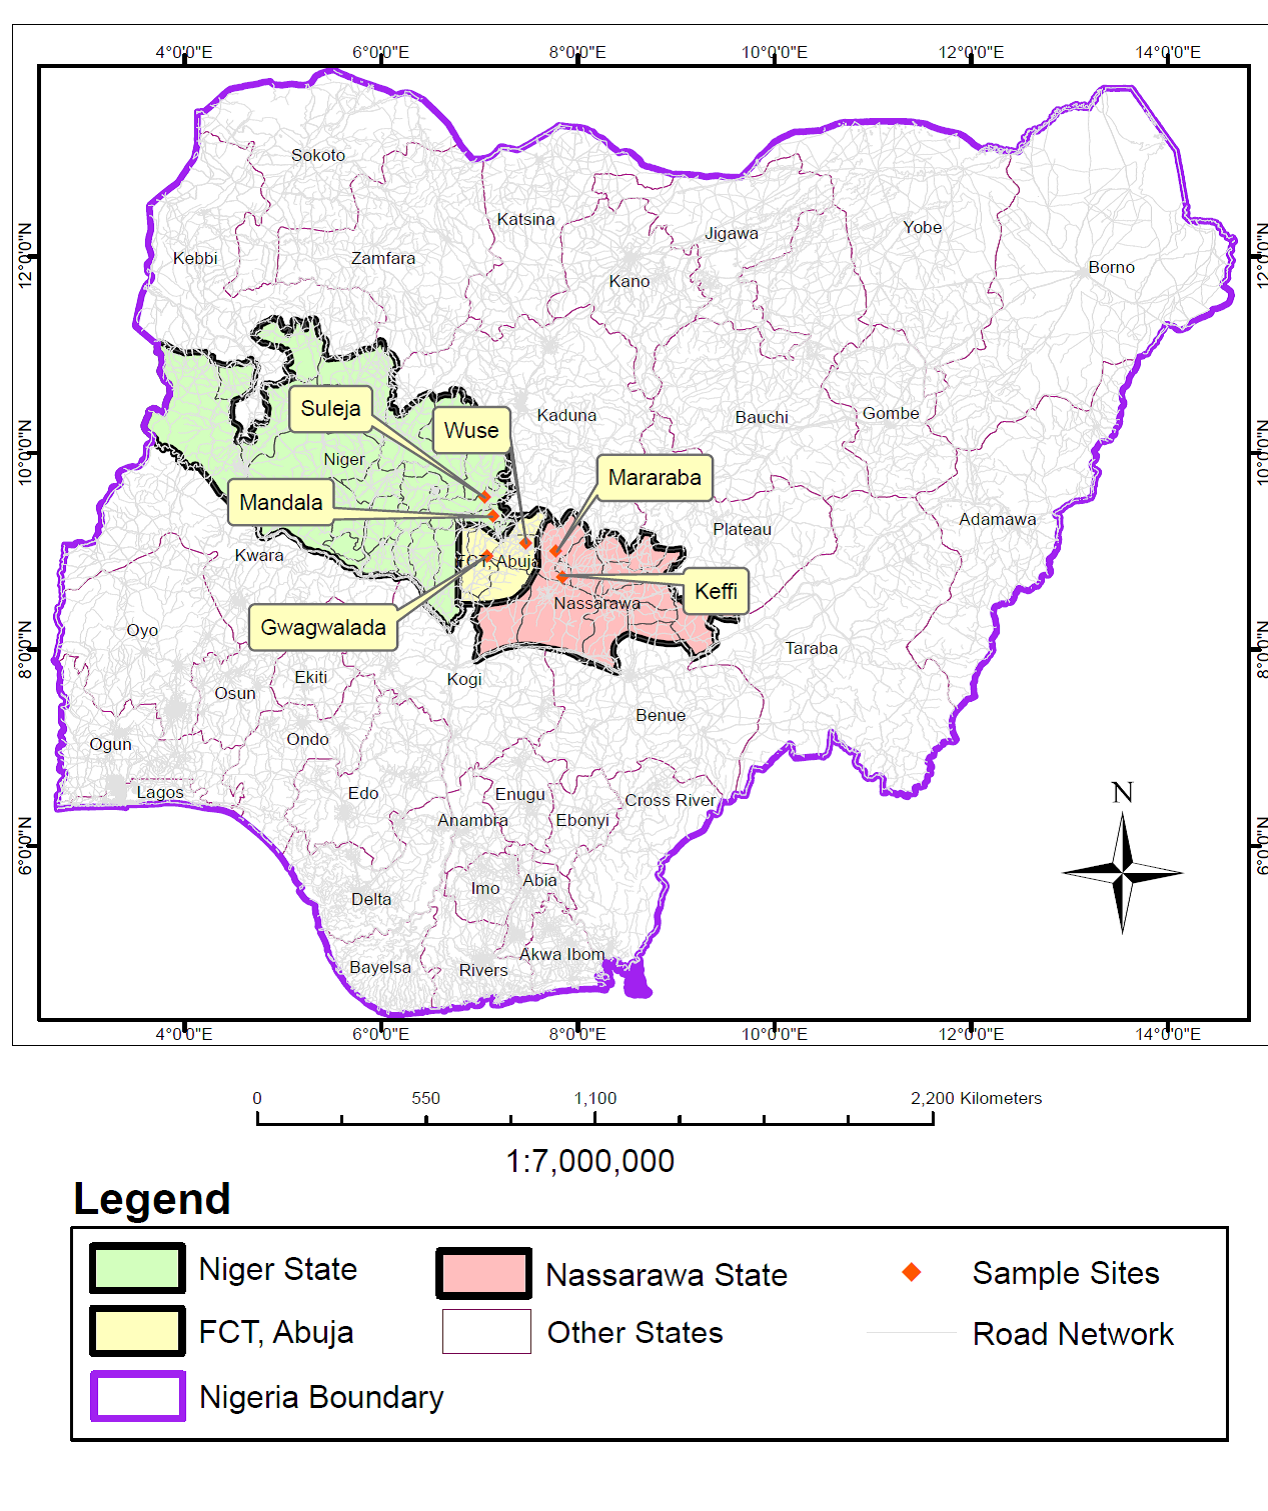
This study focuses on three of the fastest-growing urban centers within the North-central region: Abuja, Nigeria’s capital, and its neighboring states, Nasarawa and Niger. Abuja, designated as the Federal Capital Territory, was created to replace the overcrowded former capital of Lagos, which offered limited growth potential. Consequently, residents were resettled to nearby cities like Suleja (Niger State) and New Karshi (Nasarawa State), forming peripheries around the territory [10,11]. Strategically located at the confluence of the Benue and Niger Rivers, Abuja sits near the nation’s geographic center. It is bordered by Kaduna (northeast), Kogi (southwest), Niger State (west and north), and Nasarawa (east and south), lying between longitude 6.45 and 7.39 east and latitude 8.25 and 9.20 north. Abuja has an approximate landmass of 7,315 km2 and enjoys a moderate climate within the Savannah region. Hausa and English are the primary languages spoken in the FCT [10,11].
Nasarawa State was formed on October 1, 1996, from the neighboring Plateau State. Its borders include Kogi and Benue (south), Kaduna (north), Taraba and Plateau (east), and the FCT (west). Agriculture is the economic mainstay, producing diverse cash crops year-round. It also possesses mineral resources like bauxite, salt, and baryte. Niger State, the country’s largest, takes its name from the River Niger. Its capital is Minna [2,3], and it hosts three major hydroelectric power stations: the Shiroro, Kainji, and Zungeru Dams. Covering 76,363 \(km^2\), Niger State had a population of 3,954,772 in 2006. Its population includes various indigenous tribes such as the Kamuku, Nupe, Kambari, Gbagyi, Hausa, Koro, and Hun-Saare [10,11]. Notable institutions within Niger State include the Federal University of Technology Minna, Federal Polytechnic Bida, and Niger State Polytechnic Zungeru. For geographical reference, please see Figure 1.
The techniques encompasses of travelers within case study provinces, data was gathered through questionnaire as well as field investigation. The questionnaire utilized was from prior studies but it was upgradedto suite this scrutiny purpose. Field survey encompasses of trip to city and points collection within North-central Nigeria.
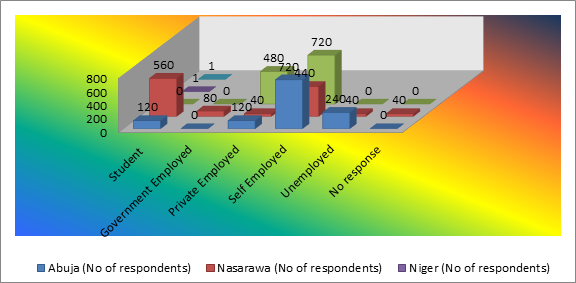
The demographic investigation (Gender and Profession) formed using the three regions Questionnaire that were dispensed to four hundred travelers selected randomly making total of 1200 respondents are presented in Figure 2 and 3.

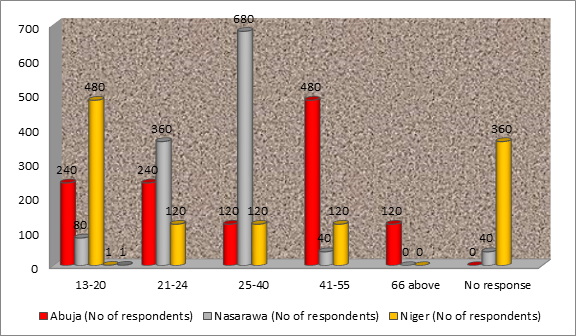
The Age group and religions formed using the three regions Questionnaire that were dispensed to four hundred travellers selected randomly making total of 1200 respondents are presented in Figure 4 and 5.

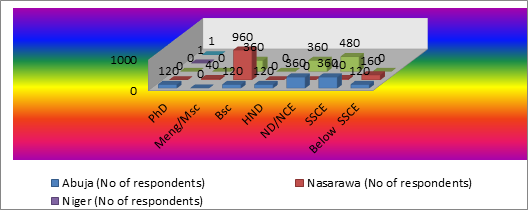
The Education level produced using the three regions Questionnaire that were dispensed to four hundred travellers selected randomly making total of 1200 respondents are presented in Figure 6.
The salary produced using the three regions Questionnaire that were dispensed to four hundred travellers selected randomly making total of 1200 respondentsare presented in Figure 7.
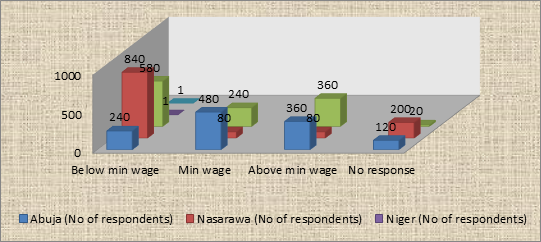
Figures 2 – 7 shows that demographic figures (sex, profession, age, religion, education and salary) for each of the three zones, female travellers more than men, Self-employed travellers has the highest, between 25 and 40 years travelled most, Christian travellers are more than other religions, while travellers with at least degree certificate travelled most and the highest income is below minimum wage.
These results specify thatprofession, age and education level of the populace regulate travel management which is inagreement with paper work by Loo 2007 and Golob 2003.
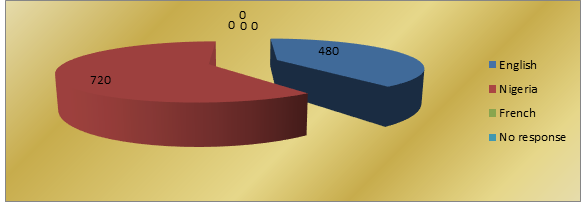
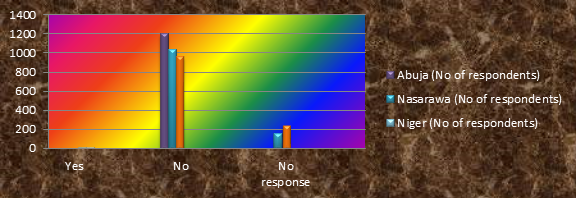
The socio-economic pattern (language, nationality and community safety) formed using the three regions Questionnaire that were dispensed to four hundred travellers selected randomly making total of 1200 respondents are presented in Figures 8-10.

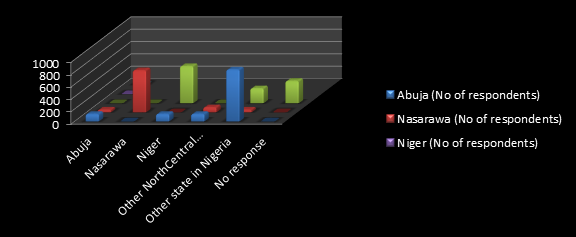
The state, disability and tribe formed using the three regions Questionnaire that were dispensed to four hundred travellers selected randomly making total of 1200 respondents are presented in Figure 11, 12 and 13.

Numbers of trips formed using the three regions Questionnaire that were dispensed to four hundred travellers selected randomly making total of 1200 respondents are presented in Figure 14.
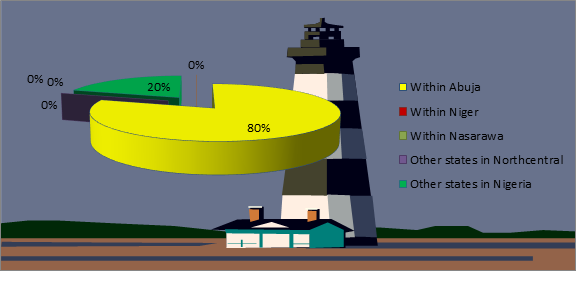
The favorite destination of North-Central, Nigeria dweller using the three regions Questionnaire that were dispensed to four hundred travellers selected randomly making total of 1200 respondents are presented in Figure 15.
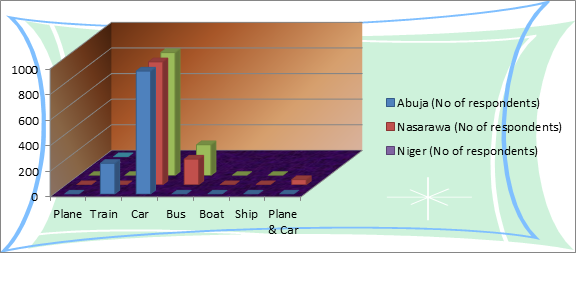
Prefer mode of mass transit transport formed using the three regions Questionnaire that were dispensed to four hundred travellers selected randomly making total of 1200 respondents are presented in Figure 16.
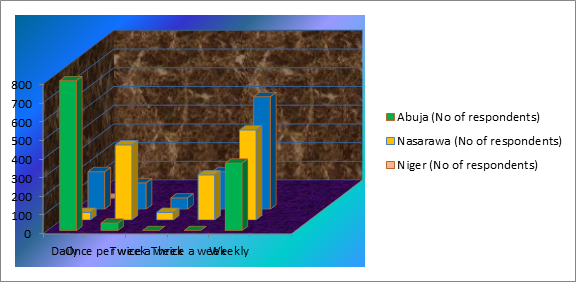
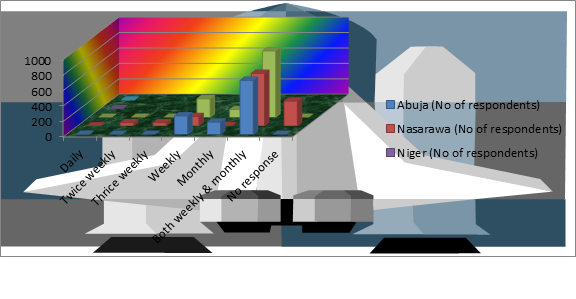
Sequence or pattern of trips formed using the three regions Questionnaire that were dispensed to four hundred travellers selected randomly making total of 1200 respondents are presented in Figure 17.
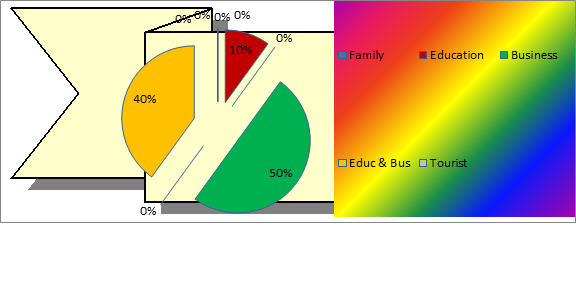
Reason why North-central dweller prefer travelling than others formed using the three regions Questionnaire that were dispensed to four hundred travellers selected randomly making total of 1200 respondents are presented in Figure 18.
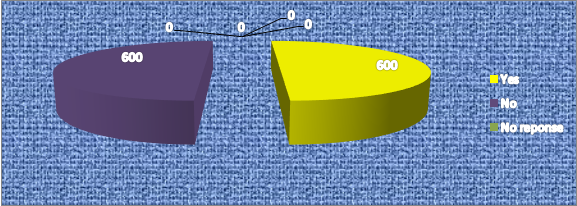
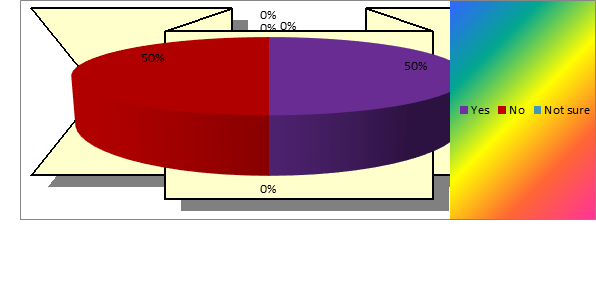
The environmental and climate impact awareness formed using the three regions Questionnaire that were dispensed to four hundred travellers selected randomly making total of 1200 respondents are presented in Figure 19.
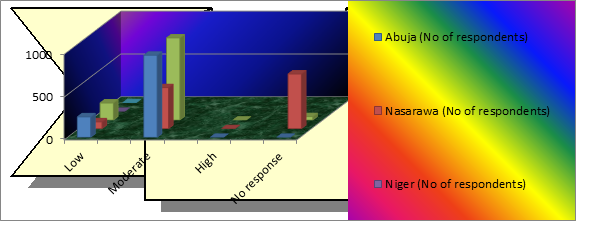
Environmental and climate impacts degree formed using the three regions Questionnaire that were dispensed to four hundred travellers selected randomly making total of 1200 respondents are presented in Figure 20.
North-central traveller opinion on travel behaviour formed using the three regions Questionnaire that were dispensed to four hundred travellers selected randomly making total of 1200 respondents are presented in Figure 21.
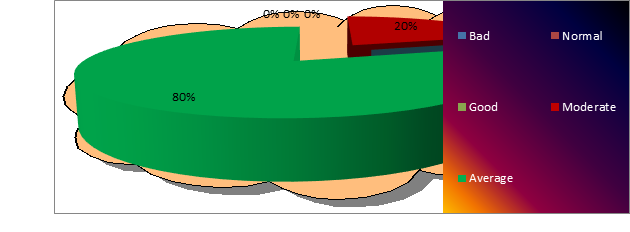
Suggestion of ways to promote travel behavior within society formed using the three regions Questionnaire that were dispensed to four hundred travelers selected randomly making total of 1200 respondents are presented in Figure 22.
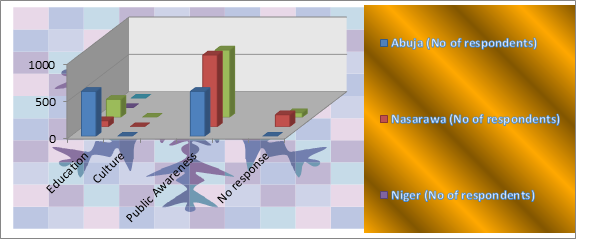
Figure 8 – 22 illustrations that travel behavior for each of the three zones, daily has highest number of trips followed by weekly, whereas North-central dweller favorite destination is Abuja though majority are from other state in Nigeria. The highest mode of traveling is car, while the patterns or sequences of trips are both weekly and monthly.Besides, the reason North-central travelers prefer traveling then stay at home, telescope or telecommute is business followed by tourist, environmental and climate impacts degree is moderate, though majority are aware of environmental and climate impact. On the evaluation on people travel behavior majority indicated average rate, while public awareness has the highest respondent on how to promote travel behavior within society.These outcomes stipulate that North-central people prefer train but not available that why they used car often though costly compare to buses, whereas travel behavior is on the average but with public awareness and education it will improve which is in agreement with paper work by [13-15]
The statistics formed using the three regions Questionnaire that were dispensed to four hundred travelers selected randomly making total of 1200 respondents are shown in Table 1 & 2 and graphically indicated in Figure 23.
| North-central | N | Minimum | Maximum | Sum | Mean | Std. Devia | Variance | Skewness | |
| Statistic | Statistic | Statistic | Statistic | Statistic | Statistic | Statistic | Statistic | Std. Error | |
| No of Respondant | |||||||||
| Student | 3 | 0 | 560 | 680 | 226.67 | 294.845 | 86933.33 | 1.415 | 1.225 |
| Government Employed | 3 | 0 | 80 | 80 | 26.67 | 46.188 | 2133.333 | 1.732 | 1.225 |
| Private Employed | 3 | 40 | 480 | 640 | 213.33 | 234.379 | 54933.33 | 1.508 | 1.225 |
| Self Employed | 3 | 440 | 720 | 1880 | 626.67 | 161.658 | 26133.33 | -1.732 | 1.225 |
| Unemployed | 3 | 0 | 240 | 280 | 93.33 | 128.582 | 16533.33 | 1.545 | 1.225 |
| No response | 3 | 0 | 40 | 40 | 13.33 | 23.094 | 533.333 | 1.732 | 1.225 |
| Frequency (N) | Student | Government Employed | Private Employed | Self Employed | Unemployed | No response | |
| No of respondents | |||||||
| Valid | 3 | 3 | 3 | 3 | 3 | 3 | |
| Std. Deviation | 294,845 | 46.188 | 234.379 | 161.658 | 128,582 | 23.094 | |
| Variance | 85933.33 | 2133.333 | 54933.333 | 26133.333 | 16533.333 | 533.333 | |
| Skewness | 1,415 | 1.732 | 1.508 | -1.732 | 1.545 | 1.732 | |
| Std. Error of Skewness | 1.225 | 1.225 | 1.225 | 1.225 | 1.225 | 1.225 | |
| Minimum | 0 | 0 | 40 | 440 | 0 | 0 | |
| Maximum | 560 | 80 | 480 | 720 | 240 | 40 | |
| Percentiles | 25 | 0 | 0 | 40 | 440 | 0 | 0 |
| 50 | 120 | 0 | 120 | 720 | 40 | 0 | |
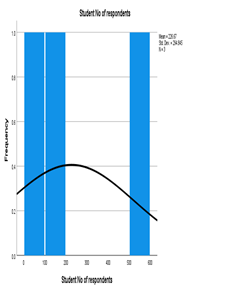
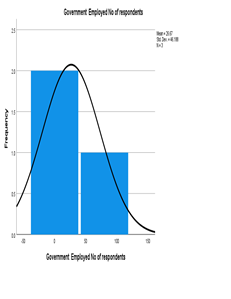
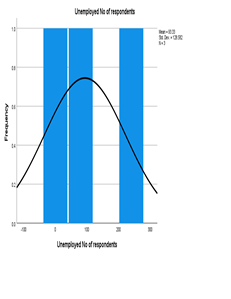
Result Table 1 and 2, which was represented graphically in Figure 23, displayed that self-employed has the extreme mean (626.67 respondents), then students (226.67 respondents), while no responses the lowest with value at (13.33 respondents). Similarly, student shave the maximum Standard deviation (294.845 respondents). It was seconded by private employed (234.379 respondents), while no response have the least value of (23.094 respondents).
The linear and multiple regression formed using the three regions Questionnaire that were dispensed to four hundred travelers selected randomly making total of 1200 respondents are shown in Table 3 & 4 and graphically represented in Figures 24 – 25.
| Power Analysis Table | |||||
| Powerb | Test Assumptions | ||||
| N | Std. Dev. | Effect Size | Sig. | ||
| Test for Meana | .212 | 10 | 294 | .408 | .05 |
| a. Two-sided test. | |||||
| b. Based on non central t-distribution. | |||||
| Posterior Distribution Characterization for Pairwise Correlations | ||||||||
| Student no of Respondants | Government Employed no of Respondants | Private Employed no of Respondants | Self Employed no of Respondants | Un Employed no of Respondants | No of Response | |||
| Student no of Respondants | Posterior | Mode | 0.96 | -0.677 | -0.96 | -0.122 | 0.96 | |
| Mean | 0.783 | -0.308 | -0.785 | -0.019 | 0.786 | |||
| Variance | 0.083 | 0.0208 | 0.081 | 0.174 | 0.081 | |||
| MIN Credible Interval | Lower Bound | 0.153 | -0.979 | -1 | -0.789 | 0.164 | ||
| upper Bound | 1 | 0.564 | -0.164 | -0.721 | 1 | |||
| N | 3 | 3 | 3 | 3 | 3 | 3 | ||
| Government Employed No of Respondant | Posterior | Mode | 0.96 | -0.524 | -0.276 | |||
| Mean | 0.783 | -0.176 | -0.058 | |||||
| Variance | 0.083 | 0.202 | 0.181 | |||||
| 95% Credible interval | Lower Bound | 0.153 | -0.928 | -0.796 | ||||
| upper Bound | 1 | 0.64 | 0.738 | |||||
| N | 3 | 3 | 3 | 3 | 3 | 3 | ||
| Private Employed No of respondents | Posterior | Mode | -0.677 | -0.524 | 0.524 | -0.383 | -0.524 | |
| Mean | -0.308 | -0.176 | 0.177 | -0.106 | -0.172 | |||
| Variance | 0.0208 | 0.202 | 0.203 | 0.192 | 0.205 | |||
| 95% Credible interval | Lower Bound | -0.979 | -0.928 | -0.634 | -0.871 | -0.921 | ||
| upper Bound | 0.564 | 0.64 | 0.937 | 0.673 | 0.66 | |||
| N | 3 | 3 | 3 | 3 | 3 | 3 | ||
| Self employed No or respondents | Posterior | Mode | -0.96 | 0.524 | 0.276 | |||
| Mean | -0.785 | 0.177 | 0.062 | |||||
| Variance | 0.081 | 0.203 | 0.179 | |||||
| 95% Credible interval | Lower Bound | -1 | -0.634 | -0.681 | ||||
| upper Bound | -0.164 | 0.937 | 0.841 | |||||
| N | 3 | 3 | 3 | 3 | 3 | 3 | ||
| Unemployed No of Respondant | Posterior | Mode | -0.122 | -0.276 | -0.383 | 0.276 | 0.276 | |
| Mean | -0.019 | -0.058 | -0.106 | 0.062 | 0.07 | |||
| Variance | 0.174 | 0.181 | 0.192 | 0.179 | 0.184 | |||
| 95% Credible interval | Lower Bound | -0.789 | -0.796 | -0.871 | -0.681 | 0.83 | ||
| upper Bound | -0.721 | 0.738 | 0.673 | 0.841 | 0.706 | |||
| N | 3 | 3 | 3 | 3 | 3 | 3 | ||
| No of Response | Posterior | Mode | 0.96 | -0.524 | 0.276 | |||
| Mean | 0.786 | -0.172 | 0.07 | |||||
| Variance | 0.081 | 0.205 | 0.184 | |||||
| 95% Credible interval | Lower Bound | 0.164 | -0.921 | 0.83 | ||||
| upper Bound | 1 | 0.66 | 0.706 | |||||
| N | 3 | 3 | 3 | 3 | 3 | 3 | ||
| a. The analysis assume reference prior (c=0) | ||||||||
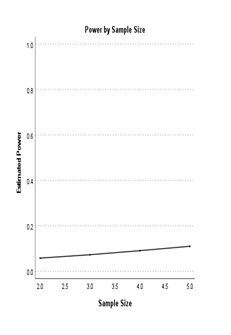

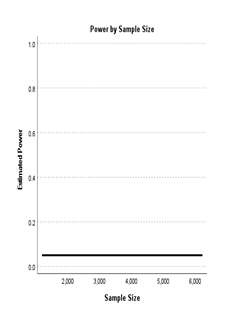

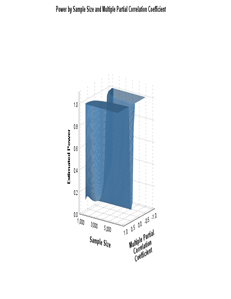
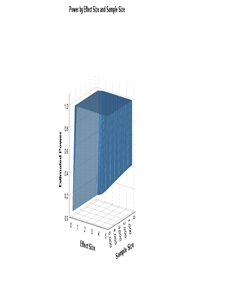
Result from Table 3 & 4 which was graphically represented in Figure 26 achieved via power analysis two side test, which was based on non-central t-distribution techniques. Showed standard deviation of 294 respondents with 408 sample size and less than one significant level. Students / Government employed respondents correlated with mode of 0.98, and mean of 0.783, whereas no response has lowest connectivity level with mode and mean values of -0.276 and -0.070 respectively.
The cluster scrutiny formed using the three regions Questionnaire that were dispensed to four hundred travelers selected randomly making total of 1200 respondents are shown in Table 5 & 6 and graphically displayed in Figure 26.
| Proximity Matrix | |||
| Case | Squared Euclidean Distance | ||
| 2: | 3: | 4: | |
| 2: | .000 | 326400.000 | 201600.000 |
| 3: | 326400.000 | .000 | 595200.000 |
| 4: | 201600.000 | 595200.000 | .000 |
| This is a dissimilarity matrix | |||
| Agglomeration Schedule | ||||||
| Stage | Cluster Combined | Coefficients | Stage Cluster First Appears | Next Stage | ||
| Cluster 1 | Cluster 2 | Cluster 1 | Cluster 2 | |||
| 1 | 2 | 4 | 100800.000 | 0 | 0 | 2 |
| 2 | 2 | 3 | 374400.000 | 1 | 0 | 0 |
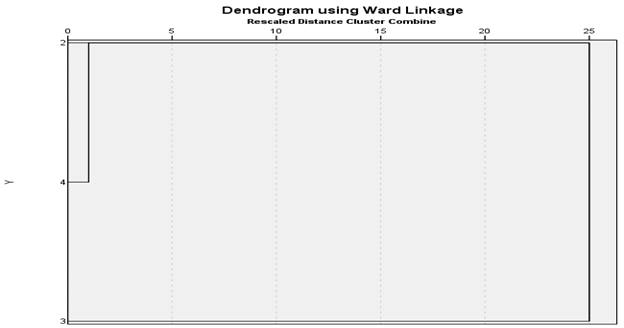
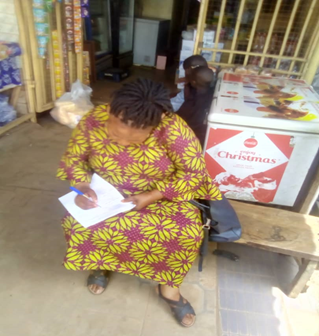
Result from Table 5 & 6 which was graphically represented in Figure 26 achieved via squared Euclidean distances for similarity measurement which in turn generated a deprogram. It detect connection groups among st the respondents. Two statistically substantial Clusters are created 1 and 2, which created two (2) sets of connection between the respondents which is in agreement with paper work by [9,16]. Meanwhile, Figure 27 showed respondents within North-central Nigeria filling the questionnaires.

This study examined the transportation system in North-central Nigeria. A survey of travel behavior indicated a majority of respondents reporting average travel frequency, with public awareness campaigns identified as the most common suggestion for promoting positive travel behavior. Descriptive statistics revealed self-employed individuals having the highest mean travel frequency (626.67 respondents), followed by students (226.67 respondents). No-response individuals had the lowest frequency (13.33 respondents). Students also demonstrated the highest standard deviation (294.845 respondents). Power analysis using a non-central t-distribution indicated a standard deviation of 294 respondents with a sample size of 408 and a significance level below 0.01. Correlation analysis showed a strong connection (0.98) between student/government employee respondents and their transportation mode, with a mean of 0.783. Conversely, no-response individuals exhibited the weakest correlation, with mode and mean values of -0.276 and -0.070 respectively. Two statistically significant clusters were identified, implying two distinct sets of connections among respondents. To improve transportation outcomes, faster, more accessible, and cost-effective options like trains should be introduced to reduce traffic congestion. Additionally, government agencies, transportation authorities, and private operators should prioritize education and awareness campaigns to influence positive travel behavior.