Contents

Simultaneous Determination of Fexofenadine HCl and Pseudoephedrine HCl in Combined Pharmaceutical Dosage Form

Author(s): Sajid Mahmood1, Zaheer Ahmad2, Muhammad Arshad3
1Division of Science and Technology, University of Education, Lahore-54590, Pakistan.
2Department of Chemistry, University of Wah, Wah Cantt, Pakistan.
3Institute of Chemistry, University of the Punjab, Lahore, Pakistan.
Copyright © Sajid Mahmood, Zaheer Ahmad, Muhammad Arshad. This is an open access article distributed under the Creative Commons Attribution License, which permits unrestricted use, distribution, and reproduction in any medium, provided the original work is properly cited.

Abstract

The objective of the present work was to develop and validate of an analytical method for the quantitative determination of Fexo. HCL and Pseudo. HCL in a combine tablet dosage form by \(UV-V\) is spectrophotometry and TLC. The main problem was to separate the two active ingredient from a single bilayered tablet because both the A.P.I’s were soluble in the same solvents. As media selection, distilled water and ethanol \((1:1)\) were used for Pseudo. HCl and methanol for Fexo. HCl, in which both the drugs were soluble and stable for a sufficient time. Both drugs were measured at \(220\)nm and \(247\)nm, where they showed maximum absorbance. Beer Lambert’s law was obeyed at concentration range \(4-14\) ppm and \(5-30\) ppm for Fexo. HCL and Pseudo HCL respectively. Fexo. HCl \((Y=0.0643x+0.9370)\) was measured with correlation coefficient \(r =0.9574\) and Pseudo. HCl \((Y=0.0843x+0.0219)\) with correlation coefficient \(r =0.9992\). The results of analysis have been validated statistically and recovery studies were carried out as \(99.29\%\pm 0.943\) and \(99.29\%\pm 0.941\) which were close to the assay value \(100.1\% \& 100.6 \%\). Precision of the method was measured which showed results for SD \((99.57 \% \;\;\& \;\;99. 51% )\) and \(\%\) RSD \((99.53 \%\;\; \&\;\; 99.54)\). The proposed method may be suitably applied for the analysis of Fexo. HCL and Pseudo.HCL in tablet pharmaceutical formulation for routine analysis.

Keywords: Fexofenadine HCl; Pseudoephedrine HCl; Validation; \(UV-V\) spectrophotometer; Nasal decongestant; Water-Ethanol \((1:1)\)

1. Introduction

Pseudoephedrine is the most popular active nasal decongestant due to its effectiveness and relatively mild side effects [1]. In recent years, it has become increasingly difficult to obtain pseudoephedrine in many states because of its use as a precursor for the illegal drug N-methyl amphetamine (also known under various names including crystal meth, meth ice, etc.) [2]. Fexofenadine, 2-[4-(1-hydroxy-4-{4-[hydroxyl (biphenyl) methyl] piperidin-1-yl} butyl) phenyl]-2-methylpropanoic acid is a highly selective peripheral histamine H1 receptor antagonist used in the treatment of allergic diseases such as allergic rhinitis and chronic urticarial.
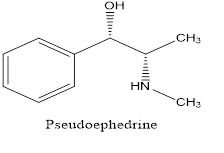
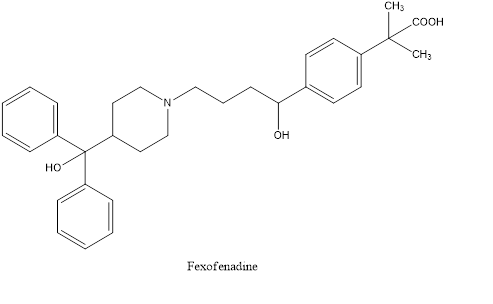
Fexofenadine is the active derivative of the antihistamine terfenadine, with no anti-cholinergic or alpha 1-adernergic receptor-blocking effects and without severe cardiac side effects of terfenadine [3, 4]. In literature survey many analytical methods have been reported for the estimating of individual Pseudoephedrine hydrochloride [5, 6],few HPLC assay and dissolution methods have been reported for determination of fexofenadine in pharmaceutical preparation [7].The estimation of fexofenadine in biological fluids using liquid chromatography with mass spectrometry [8], ionspray tandem mass spectrometry [9], electronspray tandem mass spectrometry [10], UV detection [11, 1], [Christopher MR et al., (1995)], but no work has so far been carried out for the simultaneous determination of Fexo. HCl and Pseudo.HCl in combine tablet dosage form by UV-vis spectrophotometry. The aim of the present study is to develop and validate a new and economical method for the simultaneous determination of Fexo. HCl and Pseudo.HCl in combine pharmaceutical tablet preparations. The method was validated in compliance with ICH guidelines [12].

2. Materials and method

2.1 Chemicals and reagents

The reference standards Fexofenadine HCl and Pseudoephedrine HCl (99.4%) pure were received as a gift sample from Java Pharmaceutical Kot Lakhpat, Lahore. Organic solvents ethanol and methanol (AR grade) was procured from Merck Chemical. Distilled water was used throughout the study. Sample tablets Fexet-D (Fexo. HCl and Pseudo. HCl 60mg/120mg) were purchased from local market Lahore., Pakistan.

2.2 Apparatus

TLC tank was used for the separation of both drugs. A single beam UV-Spectrophotometer (Cecil CE 2041, 2000 series) was used for the measurement. Analytical balance (JS-110, Japan) was used to weigh the sample and standard (Fexo. HCl and Pseudo.HCl ) material.

2.3 Selection of common solvent

Main criteria for media selection was solubility and stability, i.e. Fexo. HCl and Pseudo. HCl should be soluble as well as stable for sufficient time in selected media Pseudo. HCl show solubility in distilled water and ethanol (1:1) and Fexo. HCl in methanol respectively. It is economical and hence selected for analysis.

3. Methodology

3.1 Thin layer Chromatograph

The grind powder of tablet was dissolved in methanol and filtered the solution with fliter paper. The obtained concentrated solution was subjected on precoated silica gel plates. The polarity system CHCl3/n-Hexane (80:20%) was developed for TLC. The two A.P.I’s were separated which showed the Rf values 0.25±0.01 and 0.67+/-0.01 for Fexo. HCl and Pseudo. HCl respectively. As media selection, distilled water and ethanol (1:1) were used for Pseudo. HCl and methanol for Fexo.HCl, in which both the drugs were soluble and stable for a sufficient time.

3.2 Preparation of standard stock solutions and calibration curve

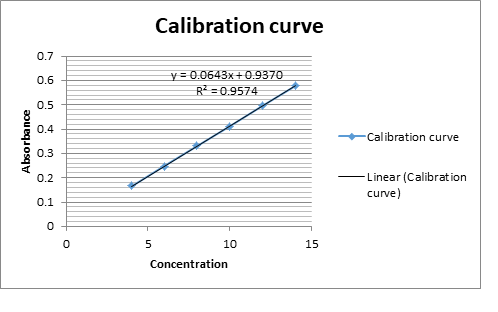
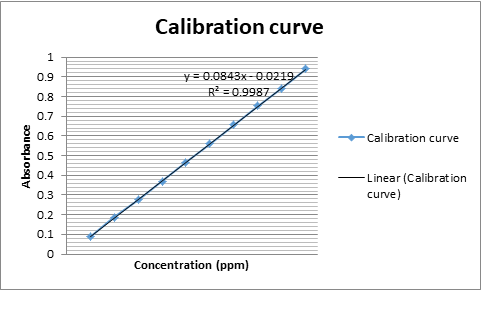
An accurately weighed 100mg each Fexo.HCl and Pseudo. HCl (reference standards) were transferred to two 100 ml volumetric flask separately and dissolved in methanol and distilled water/ethanol (1:1) individually and make up the volume up to the mark with the same solvent to obtain standard solution having concentration 1000ppm. Magnetic stirrer was used for better dissolution. Further 10ppm dissolution was made by taking 1ml from each of the above solution and make up the volume to 100ml with methanol and distilled water/ethanol (1:1). The working standard solutions 10 μg/mL of Fexo.HCl and Pseudo. HCl were scanned in the entire uv range 200-400nm to obtain the absorption spectra Fexo. HCl and Pseudo. HCl showed maximum absorption at 220nm and 247nm respectively. Further six dilutions from each stock solution were made with their respective solvents in the range 4-14 μg/mL and 5-30 μg/mL for Fexo. HCl and Pseudo.HCl respectively. The absorbance of resulting solutions were measured at respective \(\lambda_{max}\) and plotted a calibration curve against concentration to get the linearity and regression equation as shown in Fig.1.

3.3 Application of the Proposed Procedure for the Determination in Tablets

The proposed method was applied to determine the concentration of active drug in tablets dosage form. Twenty tablets were weighed and crushed to fine powder, drug equivalent to 60 mg and 120 mg Fexo. HCl and Pseudo. HCl was weighed and taken in 100 ml volumetric flask and make up the volume with methanol and distilled water/ethanol (1:1) respectively. The above solution was filtered by using Whattmann filter paper No. 41. From the above filtrate 10 ppm solution of each active drug was made and subjected for analysis. Analysis procedure was repeated six times with tablet formulation. Aliquot was scanned in the UV range (200-400nm).The amount of drug present in the tablets was calculated from the standard graphs as given in Table I.

3.4 Assay Measurement

The mean assay results of six sample tablets were comparable with claimed value. The obtained results are presented in Table-I and percentage was found to be 100.1% and 100.6% respectively.

Table I – Assay Determination of Fexo .HCl and Pseudo. HCl from its Tablet

Sample Tablet Label Claimed Amount Found mg ∕Tab. Mean % Assay
Fexo .HCl 220 nm 60 mg 60.1 mg 100.1 %
Pseudo. HCl 247 nm 120 mg 120.8 mg 100.6 %

4 Method Validation

The developed method was validated by following parameters as provided by ICH.

4.1 Specificity

The sample and the standard spectra were scanned to check the specificity of the method. There was not found any interference of the excipients for the determination of Fexo. HCl and Pseudo. HCl which confirmed the method is highly specified for the estimation of Fexo. HCl and Pseudo.HCl in its tablet formulation.

4.2 Linearity

Various concentrations of the both analyte were made to measure the linearity of the method. The concentration range was 4-14 ppm at 220nm for Fexo. HCl and 5-30 ppm at 247nm for Pseudo.HCl. A calibration curve of absorbance versus concentration was plotted. Regression analysis was the confirmation of linearity of this method

Table II -Regression Analysis Fexo. HCl and Pseudo. HCl

Samples Parameters Results
FexofendineHCl Regression equation Y= 0.0643x + 0.9370
Regression coefficient \(R^2\) =0.9574
Correlation coefficient R = 0.9993
PseuoephdrineHCl Regression equation Y= 0.0843x + 0.0219
Regression coefficient \(R^2\) =0.9987
Correlation coefficient R = 0.9992

4.3 Accuracy

To ensure the accuracy of method, recovery study was performed by preparing six sample solutions of both drugs and added a known amount of active drug to each sample solution then measuring absorbance at 220nm and 247nm respectively. The % recovery was calculated along with SD and % RSD as listed in table II&III.

Table III – % Recovery Result of Fexofenadine HCl

Samples after
addition
Absorbance after
addition
% Recovery Assay
Sample 1
0.717 99.88 %
Sample 2
0.708 97.6 %
Sample 3
0.713 99.86 %
Sample 4 0.721 100.2%
Sample 5 0.715 99.23 %
Sample 6 0.720

Mean % Recovery Assay± SD
98.99 %± 0.943

Mean% Recovery Assay± %RSD
99.29 %± 0.95

Table IV – % Recovery result of Pseudoephedrine HCl

Samples after
addition
Absorbance after
addition
% Recovery Assay
Sample 1
0.178 99.88 %
Sample 2
0.172 97.6 %
Sample 3
0.179 99.86 %
Sample 4 0.176 100.2%
Sample 5 0.177 99.23 %
Sample 6 0.174 98.99 %

Mean % Recovery Assay± SD
99.29 %± 0.941

Mean% Recovery Assay± RSD
99.29 %± 0.93

4.4 Precision

Two different tablet solution was taken to measure the precision of method (Tablet-A and Tablet-B) and comparing the value of mean percentage assay with the proposed assay. The mean percentage (%) assay of the tablets was found to be very close to the proposed assay value (100.1 % and 100.6 %) respectively both for Fexo. HCl and Pseudo.HCl. Hence the assay method was found to be precise.

Table V – % Assay result of Tablet-A and Tablet –B

Fexofenadine HCl
Absorbance of Tablet-A % Assay of Tablet-A Absorbance of Tablet-B % Assay of Tablet-B
Sample 1 0.717 99.6 % 0.716 99.26%
Sample 2 0.708 99.51 % 0.702 99.53%
Sample 3 0.713 100.2 % 0.709 98.77%
Sample 4 0.721 99.02% 0.714 100.11%
Sample 5 0.715 100.48 % 0.719 99.75%
Sample 6 0.720 98.65 % 0.723 100.8%
Mean % Recovery Assay± SD 99.57 %±0.689 99.53%± 0.851
Mean % Recovery Assay± %RSD 99.57 %±0.691 99.53%±0.854

Table VI – % Assay result of Tablet-A and Tablet –B

Fexofenadine HCl Absorbance of Tablet-A % Assay of Tablet-A Absorbance of Tablet-B % Assay of Tablet-B
Sample 1 0.178 99.6 % 0.180 99.26%
Sample 2 0.172 99.51 % 0.173 99.53%
Sample 3 0.179 100.2 % 0.182 98.77%
Sample 4 0.176 99.02% 0.184 100.11%
Sample 5 0.177 100.48 % 0.181 99.75%
Sample 6 0.174 98.65 % 0.183 100.8%
Mean % Recovery Assay± SD 99.57 %±0.689 99.53%±0.851
Mean % Recovery Assay± %RSD 99.54 %±0.687 99.51%± 0.751

4.5 Robustness

Robustness was measured by changing the wavelength as 220 + 1nm and 247 + 1nm (+ 1nm 221nm, 219 nm and 248 and 246 nm). The effect of change in wavelength was observed and mean percentage assay was calculated at two different wavelengths and was found to be very close to the proposed assay value (100.1% and 100.6 %), thus the robustness parameter was passed by the sample tablets.

Table VII – % Assay Result of \(\lambda_{max+ 1}\) and \(\lambda_{max–1}\) Conditions

Fexofenadine HCl Wavelength plus condition \(\lambda_{max+ 1}\) Wavelength subtract condition\(\lambda_{max- 1}\)
Absorbance % Assay Absorbance % Assay
Sample 1 0.715 100.4 % 0.719 99.75 %
Sample 2 0.720 98.65% 0.723 100.8 %
Sample 3 0.713 100.2% 0.716 99.26%
Sample 4 0.721 99.02% 0.702 99.53%
Sample 5 0.708 99.5 % 0.714 100.11
Sample 6 0.717 99.6% 0.709 98.75%
Mean % Recovery Assay± SD 99.34 %±0.836 99.43%±0.913
Mean % Recovery Assay± %RSD 99.57 %±0.841 99.53%± 0.915

Table VIII – % Assay result of \(\lambda_{max+ 1}\) and \(\lambda_{max1}\) Conditions

Fexofenadine HCl Wavelength plus condition \(\lambda_{max+1}\) Wavelength subtract condition \(\lambda_{max-1}\)
Absorbance % Assay Absorbance % Assay
Sample 1 0.178 99.60 % 0.176 99.02 %
Sample 2
0.172 99.51 % 0.177 100.48 %
Sample 3 0.179 100.2% 0.174 98.65%
Sample 4 0.180 99.26% 0.184 100.11 %
Sample 5 0.173 99.53% 0.181 99.75 %
Sample 6 0.182 98.77% 0.183 100.8 %
Mean Recovery Assay± SD 99.34%±0.836 99.48%±0.911
Mean %Recovery Assay± %RSD 99.34%±0.841 99.48%±0.914

4.6 Ruggedness

Ruggedness was determined by analysing the sample preparations on two different days to check the Ruggedness of the method. The mean percentage % assay at twoconsecutive days was found to be very close to the proposed value (100.1% &100.6 %) respectively.

Table IX – % Assay Result of Two Different Days Say Day -1 and Day -2

Samples Day-1 Day-2
Fexofenadine HCl Absorbance % Assay Absorbance % Assay
Sample 1 0.715 100.4 % 0.721 99.02%
Sample 2 0.719 99.75 % 0.702 99.53%
Sample 3 0.723 100.8 % 0.717 99.6%
Sample 4 0.713 100.2% 0.714 100.11%
Sample 5 0.720 98.65% 0.709 98.75%
Sample 6 0.716 99.26% 0.708 99.5 %
Mean %Recovery Assay±SD 99.39%±0.763 99.58%± 0.968

Mean %Recovery Assay± %RSD
99.39 %±0.763 99.58%± 0.968

Table X – % Assay result of two different days say Day -1 and Day

Samples Day-1 Day-2
Pseudoephedrine HCl Absorbance % Assay Absorbance % Assay
Sample 1 0.178 99.87 % 0.182 98.77 %
Sample 2 0.173 99.38 % 0.179 99.88 %
Sample 3 0.184 100.4% 0.183 100.03%
Sample 4 0.181 99.51% 0.176 99.75 %
Sample 5 0.177 99.02% 0.180 98.38 %
Sample 6 0.172 98.16% 0.174 101 %
Mean %Recovery Assay± SD 99.39%±0.763 99.78%±0.968
Mean %Recovery Assay± %RSD 99.39%±0.767 99.78%±0.971

4.7 LOD and LOQ

The LOD and LOQ of Fexo.HCl and Pseudo. HCl in its tablet formulation by proposed method were determined using calibration standards. LOD and LOQ were calculated and the results are shown in Table 11.

Table 11. Limit of Detection (LOD) and Limit of Quantitation (LOQ) Results

Samples Parameters Results
FexofendineHCl Slope 0.0643
Standard deviation 0.021
LOD 1.077 ppm
LOQ 3.265 ppm
PseuoephdrineHCl Slope 0.0843
Standard deviation 0.03
LOD 1.174 ppm
LOQ 3.585 ppm

5. Results and Discussions

Fexofenadine HCl and Pseudoephedrine HCl are used as antiallergic and nasal decongestant respectively. The present article deals with the development and validation of a new and an economical method for the simultaneous determination of Fexo. HCl and Pseudo. HCl in combine tablet dosage form by uv-vis spectrophotometry and TLC. The two drugs are present combine in the ratio of (1:2) which poses a problem in their assay determination. The main problem was to separate the two active ingredient from a single bilayered tablet because both the A.P.I’s were soluble in the same solvents. The published method was carried out on HPLC which is time taking and expensive for the routine analysis of pharmaceutical sectors. However , we have made an attempt to separate both the drugs by TLC and estimate it by UV-Visible spectrophotomtere which is more reliable and economical. The grind powder of tablet was dissolved in methanol and filtered the solution with fliter paper. The obtained concentrated solution was subjected on precoated silica gel plates. The polarity system CHCl3/n-Hexane (80:20%) was developed for TLC. Both the A.P.I’s were separated which showed the Rf values 0.25±0.01 and 0.67+/-0.01 for Fexo. HCl and Pseudo. HCl respectively. Visualization of single spot on TLC plate confirmed the purification of compounds. For media selection, distilled water and ethanol (1:1) were used for Pseud. HCl and methanol was used for Fexo. HCl in which both the drugs were soluble and stable for sufficient time. Both drugs were measured at 220nm and 247nm respectively, where they showed maximum absorbance. Beer Lambert’s law was obeyed at concentration range 4-14ppm and 5-30 ppm for Fexo. HCl and Pseudo.HCl respectively. A linearity curve was calibrated by concentration versus absorbance. Fexo.HCl (Y=0.0643x+0.9370) was measured with correlation coefficient r =0.9574 and Pseudo. HCl (Y=0.0843x+0.0219) with correlation coefficient r =0.9992. The results of analysis have been validated statistically and recovery studies was carried out as 99.19% and 99.29% which were close to the assay value 100.1% and 100.6% respectively. Precision of the method was measured which showed results for SD (99.57 %±) and % RSD (99.53 %±), The LOD (1.077ppm) and LOQ (3.265ppm) following ICH guidelines were measured which were found to be within limit. The proposed method was found to be specific, stable, linear, accurate, precise, and reproducible therefore it can be used for routine quality control analysis of these drugs in either alone or in combined pharmaceutical dosage forms.

Conclusion

The present method is specific, linear and reproducible thus it can be used for routine quality control analysis of these drugs in either alone or in combined pharmaceutical dosage forms.

Acknowledgement

The authors are gratified to Jawa Pharmaceutical, 112/10 Industrial area, Kot Lakhpat Lahore, Pakistan for providing a gift sample of Fexofenadine HCl and Pseudoephedrine HCl and facilities for the study. We are also thankful to Mr. Baqir Jawa (CEO) Jawa Pharmaceutical for his valuable cooperation during the whole research work.

Competing Interests

The authors declare that they have no competing interests.

References

  1. Riley, C. M., & Rosanske, T. W. (1996). Development and validation of analytical methods (Vol. 3). Elsevier.[Google Scholor]
  2. Surapaneni, S., & Khalil, S. K. (1994). A sensitive HPLC method for the determination of terfenadine and its metabolite in human plasma. Journal of Liquid Chromatography & Related Technologies, 17(11), 2419-2428. [Google Scholor]
  3. Coutant, J. E., Westmark, P. A., Nardella, P. A., Walter, S. M., & Okerholm, R. A. (1991). Determination of terfenadine and terfenadine acid metabolite in plasma using solid-phase extraction and high-performance liquid chromatography with fluorescence detection. Journal of Chromatography B: Biomedical Sciences and Applications, 570(1), 139-148. [Google Scholor]
  4. Budavari, S., O’Neil, M. J., Smith, A., & Heckelman, P. E. (1996). ln; The Merck Index., 12th Edn., Merck and Co. Inc., Whitehouse Station, NJ, 316. [Google Scholor]
  5. Ganjali, M. R., Alipour, A., Riahi, S., Larijani, B., & Norouzi, P. (2009). Quantitative analysis of pseudoephedrine in formulation by potentiometric membrane sensor; computational investigation. Int. J. Electrochem. Sci, 4, 1262-1276.[Google Scholor]
  6. Zafar, F, Shoaib, M. H., & Yousuf, R. I. (2011). Development of RP-HPLC method for fexofenadine determination in tablet formulations and development of dissolution method. Pakistan Journal of Pharmacology, 28(1), 43-49.[Google Scholor]
  7. Oliveira, D. C., Weich, A., & Rolim, C. M. B. (2007). Simple and reliable HPLC analysis of fexofenadine hydrochloride in tablets and its application to dissolution studies. Die Pharmazie-An International Journal of Pharmaceutical Sciences , 62(2), 96-100. [Google Scholor]
  8. Hofmann, U., Seiler, M., Drescher, S., & Fromm, M. F. (2002). Determination of fexofenadine in human plasma and urine by liquid chromatography–mass spectrometry. Journal of Chromatography B, 766(2), 227-233. [Google Scholor]
  9. Flynn, C. A., Alnouti, Y., & Reed, G. A. (2011). Quantification of the transporter substrate fexofenadine in cell lysates by liquid chromatography/tandem mass spectrometry. Rapid communications in mass spectrometry, 25(16), 2361-2366. [Google Scholor]
  10. Miura, M., Uno, T., Tateishi, T., & Suzuki, T. (2007). Determination of fexofenadine enantiomers in human plasma with high-performance liquid chromatography. Journal of pharmaceutical and biomedical analysis , 43(2), 741-745. [Google Scholor]
  11. Arayne, M. S., Sultana, N., Shehnaz, H., & Haider, A. (2011). RP-HPLC method for the quantitative determination of fexofenadine hydrochloride in coated tablets and human serum. Medicinal chemistry research, 20(1), 55-61. [Google Scholor]
  12. ICH Steering Committee. (1996). ICH Q2B Validation of Analytical Procedures: methodology. European Agency for the Evaluation of Medicinal Products, International Commission on Harmonisation, London (CPMP/ICH/281/95). [Google Scholor]