The objective of the present work was to develop and validate of an analytical method for the quantitative determination of Fexo. HCL and Pseudo. HCL in a combine tablet dosage form by \(UV-V\) is spectrophotometry and TLC. The main problem was to separate the two active ingredient from a single bilayered tablet because both the A.P.I’s were soluble in the same solvents. As media selection, distilled water and ethanol \((1:1)\) were used for Pseudo. HCl and methanol for Fexo. HCl, in which both the drugs were soluble and stable for a sufficient time. Both drugs were measured at \(220\)nm and \(247\)nm, where they showed maximum absorbance. Beer Lambert’s law was obeyed at concentration range \(4-14\) ppm and \(5-30\) ppm for Fexo. HCL and Pseudo HCL respectively. Fexo. HCl \((Y=0.0643x+0.9370)\) was measured with correlation coefficient \(r =0.9574\) and Pseudo. HCl \((Y=0.0843x+0.0219)\) with correlation coefficient \(r =0.9992\). The results of analysis have been validated statistically and recovery studies were carried out as \(99.29\%\pm 0.943\) and \(99.29\%\pm 0.941\) which were close to the assay value \(100.1\% \& 100.6 \%\). Precision of the method was measured which showed results for SD \((99.57 \% \;\;\& \;\;99. 51% )\) and \(\%\) RSD \((99.53 \%\;\; \&\;\; 99.54)\). The proposed method may be suitably applied for the analysis of Fexo. HCL and Pseudo.HCL in tablet pharmaceutical formulation for routine analysis.
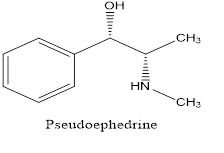
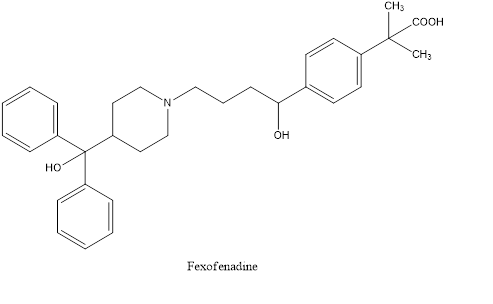
Pseudoephedrine is the most popular active nasal decongestant due to its effectiveness and relatively mild side effects [1]. In recent years, it has become increasingly difficult to obtain pseudoephedrine in many states because of its use as a precursor for the illegal drug N-methyl amphetamine (also known under various names including crystal meth, meth ice, etc.) [2]. Fexofenadine, 2-[4-(1-hydroxy-4-{4-[hydroxyl (biphenyl) methyl] piperidin-1-yl} butyl) phenyl]-2-methylpropanoic acid is a highly selective peripheral histamine H1 receptor antagonist used in the treatment of allergic diseases such as allergic rhinitis and chronic urticarial.


Fexofenadine is the active derivative of the antihistamine terfenadine, with no anti-cholinergic or alpha 1-adernergic receptor-blocking effects and without severe cardiac side effects of terfenadine [3, 4]. In literature survey many analytical methods have been reported for the estimating of individual Pseudoephedrine hydrochloride [5, 6],few HPLC assay and dissolution methods have been reported for determination of fexofenadine in pharmaceutical preparation [7].The estimation of fexofenadine in biological fluids using liquid chromatography with mass spectrometry [8], ionspray tandem mass spectrometry [9], electronspray tandem mass spectrometry [10], UV detection [11, 1], [Christopher MR et al., (1995)], but no work has so far been carried out for the simultaneous determination of Fexo. HCl and Pseudo.HCl in combine tablet dosage form by UV-vis spectrophotometry. The aim of the present study is to develop and validate a new and economical method for the simultaneous determination of Fexo. HCl and Pseudo.HCl in combine pharmaceutical tablet preparations. The method was validated in compliance with ICH guidelines [12].
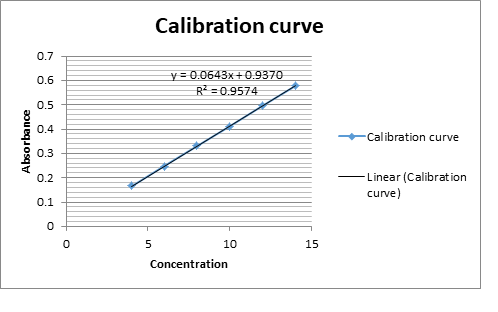
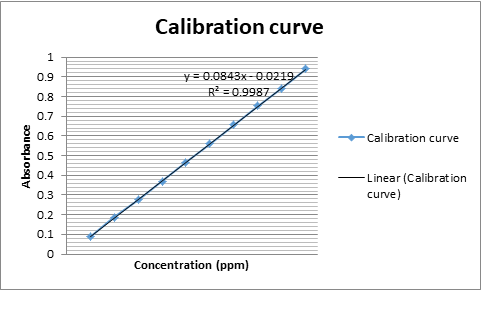
An accurately weighed 100mg each Fexo.HCl and Pseudo. HCl (reference standards) were transferred to two 100 ml volumetric flask separately and dissolved in methanol and distilled water/ethanol (1:1) individually and make up the volume up to the mark with the same solvent to obtain standard solution having concentration 1000ppm. Magnetic stirrer was used for better dissolution. Further 10ppm dissolution was made by taking 1ml from each of the above solution and make up the volume to 100ml with methanol and distilled water/ethanol (1:1). The working standard solutions 10 μg/mL of Fexo.HCl and Pseudo. HCl were scanned in the entire uv range 200-400nm to obtain the absorption spectra Fexo. HCl and Pseudo. HCl showed maximum absorption at 220nm and 247nm respectively. Further six dilutions from each stock solution were made with their respective solvents in the range 4-14 μg/mL and 5-30 μg/mL for Fexo. HCl and Pseudo.HCl respectively. The absorbance of resulting solutions were measured at respective \(\lambda_{max}\) and plotted a calibration curve against concentration to get the linearity and regression equation as shown in Fig.1.
| Sample Tablet | Label Claimed | Amount Found mg ∕Tab. | Mean % Assay | |
|---|---|---|---|---|
| Fexo .HCl | 220 nm | 60 mg | 60.1 mg | 100.1 % |
| Pseudo. HCl | 247 nm | 120 mg | 120.8 mg | 100.6 % |


| Samples | Parameters | Results |
|---|---|---|
| FexofendineHCl | Regression equation | Y= 0.0643x + 0.9370 |
| Regression coefficient | \(R^2\) =0.9574 | |
| Correlation coefficient | R = 0.9993 | |
| PseuoephdrineHCl | Regression equation | Y= 0.0843x + 0.0219 |
| Regression coefficient | \(R^2\) =0.9987 | |
| Correlation coefficient | R = 0.9992 |
| Samples after addition |
Absorbance after addition |
% Recovery Assay |
|---|---|---|
| Sample 1 |
0.717 | 99.88 % |
| Sample 2 |
0.708 | 97.6 % |
| Sample 3 |
0.713 | 99.86 % |
| Sample 4 | 0.721 | 100.2% |
| Sample 5 | 0.715 | 99.23 % |
| Sample 6 | 0.720 | |
Mean % Recovery Assay± SD |
98.99 %± 0.943 | |
Mean% Recovery Assay± %RSD |
99.29 %± 0.95 |
| Samples after addition |
Absorbance after addition |
% Recovery Assay |
|---|---|---|
| Sample 1 |
0.178 | 99.88 % |
| Sample 2 |
0.172 | 97.6 % |
| Sample 3 |
0.179 | 99.86 % |
| Sample 4 | 0.176 | 100.2% |
| Sample 5 | 0.177 | 99.23 % |
| Sample 6 | 0.174 | 98.99 % |
Mean % Recovery Assay± SD |
99.29 %± 0.941 | |
Mean% Recovery Assay± RSD |
99.29 %± 0.93 |
| Fexofenadine HCl |
Absorbance of Tablet-A | % Assay of Tablet-A | Absorbance of Tablet-B | % Assay of Tablet-B |
|---|---|---|---|---|
| Sample 1 | 0.717 | 99.6 % | 0.716 | 99.26% |
| Sample 2 | 0.708 | 99.51 % | 0.702 | 99.53% |
| Sample 3 | 0.713 | 100.2 % | 0.709 | 98.77% |
| Sample 4 | 0.721 | 99.02% | 0.714 | 100.11% |
| Sample 5 | 0.715 | 100.48 % | 0.719 | 99.75% |
| Sample 6 | 0.720 | 98.65 % | 0.723 | 100.8% |
| Mean % Recovery Assay± SD | – | 99.57 %±0.689 | – | 99.53%± 0.851 |
| Mean % Recovery Assay± %RSD | – | 99.57 %±0.691 | – | 99.53%±0.854 |
| Fexofenadine HCl | Absorbance of Tablet-A | % Assay of Tablet-A | Absorbance of Tablet-B | % Assay of Tablet-B |
|---|---|---|---|---|
| Sample 1 | 0.178 | 99.6 % | 0.180 | 99.26% |
| Sample 2 | 0.172 | 99.51 % | 0.173 | 99.53% |
| Sample 3 | 0.179 | 100.2 % | 0.182 | 98.77% |
| Sample 4 | 0.176 | 99.02% | 0.184 | 100.11% |
| Sample 5 | 0.177 | 100.48 % | 0.181 | 99.75% |
| Sample 6 | 0.174 | 98.65 % | 0.183 | 100.8% |
| Mean % Recovery Assay± SD | – | 99.57 %±0.689 | – | 99.53%±0.851 |
| Mean % Recovery Assay± %RSD | – | 99.54 %±0.687 | – | 99.51%± 0.751 |
| Fexofenadine HCl | Wavelength plus condition \(\lambda_{max+ 1}\) | Wavelength subtract condition\(\lambda_{max- 1}\) |
||
|---|---|---|---|---|
| Absorbance | % Assay | Absorbance | % Assay | |
| Sample 1 | 0.715 | 100.4 % | 0.719 | 99.75 % |
| Sample 2 | 0.720 | 98.65% | 0.723 | 100.8 % |
| Sample 3 | 0.713 | 100.2% | 0.716 | 99.26% |
| Sample 4 | 0.721 | 99.02% | 0.702 | 99.53% |
| Sample 5 | 0.708 | 99.5 % | 0.714 | 100.11 |
| Sample 6 | 0.717 | 99.6% | 0.709 | 98.75% |
| Mean % Recovery Assay± SD | – | 99.34 %±0.836 | – | 99.43%±0.913 |
| Mean % Recovery Assay± %RSD | – | 99.57 %±0.841 | – | 99.53%± 0.915 |
| Fexofenadine HCl | Wavelength plus condition \(\lambda_{max+1}\) | Wavelength subtract condition \(\lambda_{max-1}\) | ||
|---|---|---|---|---|
| Absorbance | % Assay | Absorbance | % Assay | |
| Sample 1 | 0.178 | 99.60 % | 0.176 | 99.02 % |
| Sample 2 |
0.172 | 99.51 % | 0.177 | 100.48 % |
| Sample 3 | 0.179 | 100.2% | 0.174 | 98.65% |
| Sample 4 | 0.180 | 99.26% | 0.184 | 100.11 % |
| Sample 5 | 0.173 | 99.53% | 0.181 | 99.75 % |
| Sample 6 | 0.182 | 98.77% | 0.183 | 100.8 % |
| Mean Recovery Assay± SD | – | 99.34%±0.836 | – | 99.48%±0.911 |
| Mean %Recovery Assay± %RSD | – | 99.34%±0.841 | – | 99.48%±0.914 |
| Samples | Day-1 | Day-2 | ||
|---|---|---|---|---|
| Fexofenadine HCl | Absorbance | % Assay | Absorbance | % Assay |
| Sample 1 | 0.715 | 100.4 % | 0.721 | 99.02% |
| Sample 2 | 0.719 | 99.75 % | 0.702 | 99.53% |
| Sample 3 | 0.723 | 100.8 % | 0.717 | 99.6% |
| Sample 4 | 0.713 | 100.2% | 0.714 | 100.11% |
| Sample 5 | 0.720 | 98.65% | 0.709 | 98.75% |
| Sample 6 | 0.716 | 99.26% | 0.708 | 99.5 % |
| Mean %Recovery Assay±SD | – | 99.39%±0.763 | – | 99.58%± 0.968 |
Mean %Recovery Assay± %RSD |
– | 99.39 %±0.763 | – | 99.58%± 0.968 |
| Samples | Day-1 | Day-2 |
||
|---|---|---|---|---|
| Pseudoephedrine HCl | Absorbance | % Assay | Absorbance | % Assay |
| Sample 1 | 0.178 | 99.87 % | 0.182 | 98.77 % |
| Sample 2 | 0.173 | 99.38 % | 0.179 | 99.88 % |
| Sample 3 | 0.184 | 100.4% | 0.183 | 100.03% |
| Sample 4 | 0.181 | 99.51% | 0.176 | 99.75 % |
| Sample 5 | 0.177 | 99.02% | 0.180 | 98.38 % |
| Sample 6 | 0.172 | 98.16% | 0.174 | 101 % |
| Mean %Recovery Assay± SD | – | 99.39%±0.763 | – | 99.78%±0.968 |
| Mean %Recovery Assay± %RSD | – | 99.39%±0.767 | – | 99.78%±0.971 |
| Samples | Parameters | Results |
|---|---|---|
| FexofendineHCl | Slope | 0.0643 |
| Standard deviation | 0.021 | |
| LOD | 1.077 ppm | |
| LOQ | 3.265 ppm | |
| PseuoephdrineHCl | Slope | 0.0843 |
| Standard deviation | 0.03 | |
| LOD | 1.174 ppm | |
| LOQ | 3.585 ppm |
