
Waste valorization of agro-industrial by-products is a critical strategy for achieving Sustainable Development Goal (SDG) 12, specifically 12.5 and enhance circular economy principles. By converting agricultural residue (rice husk, sugarcane bagasse, bamboo leaves, etc) into high-value materials, this approach creates a closed-loop system that reduces environmental impact and generates economic opportunities [1–3].
Brazil is the largest sugarcane producer in the world, with the sugar-ethanol industry being one of the most important sectors for the Brazilian agribusiness. The processing to produce sugar and ethanol generates straw and bagasse. These residues are burned as fuel in boilers that generate steam for energy cogeneration The burning of waste generates between 1 and 4% ash, therefore, it is estimated that between 3 and 12 million tons of sugarcane bagasse ash (SCBA) ash are produced per year [4–6].
In addition to Brazil, large volumes of SCBA are also produced annually in India, China, Thailand, Pakistan, Colombia, the Philippines, Indonesia, and Malaysia. Improper disposal of this ash poses significant environmental and public health risks [7].
SCBA is recognized as a low-cost and sustainable feedstock for silica production due to its high silica content, typically ranging from about 40 % up to over 70 % depending on soil conditions, sugarcane variety, climate, and harvest time [8]. Therefore, this residue is an alternative to energy-intensive precursors like tetraethyl orthosilicate and to conventional methods from naturally occurring sources using quartzite rock or quartz sand [9–11].
Silica nanoparticles present multiple industrial applications in the areas of medicine, agriculture, construction, cosmetics, and food production, among others [3,12] and due to its unique physiochemical properties, it has been shown to be efficient as an adsorbent for removing dyes from aqueous solutions [13–15].
Among several techniques investigated for silica extraction from biomass, the sol-gel method presents the advantages of requiring low temperatures, operational simplicity, versatility, and the use of reagents with lower toxicity potential, contributing to a more sustainable and safe process [13,16–23]. The properties of silica are strongly dependent on process variables. Optimized synthesis is crucial for improving yield, reducing energy input, and tailoring product properties for specific applications [24,25].
This study aims to evaluate the effects of various parameters of silica synthesis from sugarcane residue ash using the sol-gel method. The silica sample obtained under optimized conditions was used for the removal of dyes from aqueous solution.
All reagents used were of analytical grade. All aqueous solutions were prepared with deionized water (resistivity \(>\) 18.2 M\(\Omega\) cm) obtained from a MilliQ deionizer (Elix Millipore, Germany). Sodium hydroxide, acetic acid, sulfuric acid, and hydrochloric acid, methylene blue (MB) and crystal violet (CV) were purchased from Synth (São Paulo, Brazil). The ash sample from the burning of sugarcane residues was provided by the company COSAN S.A (Brazil). An oven (Fanen Orion model 515), a muffle furnace (Quimis – model Q-318M24), and a reflux system were used.
The synthesis of silica was carried out by a sol-gel process involving three stages. In first stage, homogeneous mixture of sugarcane waste ash (10 g) with NaOH was placed in a muffle furnace for a specific time at 10 \(^{\circ}\)C/min. In second stage, after complete cooling at room temperature, water was added to the molten mixture at the rate of 8 mL per gram of ash and the suspension was placed under reflux during a certain period of time. The suspension was then filtered to separate the residue from the sodium silicate solution. In the third stage, 6 mol L\(^{-1}\) HCl was slowly added in the sodium silicate solution with constant agitation by magnetic stirrer at 50 rpm, so that the pH decreased to 2. Then, the suspension was filtered, the silica sample was washed to remove the salt formed during the precipitation stage, and dried in an oven at 120 \(^{\circ}\)C for 12 h.
An experimental factorial design was carried out to evaluate the influence of parameters that affect the yield of silica. The design was of the \(2^n\) type (\(n = 4\)) with three repetitions at the central point, making a total of 19 experiments. The variables studied were: stoichiometry (ash:NaOH ratio by mass); fusion time and temperature and reflux time. For statistical comparison, Minitab 17’s one-way ANOVA was used with a p-value \(<\) 0.05. Table 1 shows the variables used in the design.
| Code | Variable | Lower (-1) | Central Point (0) | Upper (+1) |
|---|---|---|---|---|
| A | Fusion Temperature (\(^{\circ}\)C) | 300 | 400 | 550 |
| B | Fusion Time (min) | 30 | 60 | 90 |
| C | Stoichiometry (ash:NaOH w:w) | 1:1 | 1:1.5 | 1:2 |
| D | Reflux Time (h) | 1 | 4 | 6 |
The following mathematical model (coded) was used for experimental design:
\[\begin{aligned} Y_{ijklm} ={}& \mu + A_i + B_j + C_k + D_l + (AB)_{ij} + (AC)_{ik} + (AD)_{il} + (BC)_{jk} + (BD)_{jl} \notag\\ &+ (CD)_{kl} + (ABC)_{ijk} + (ABD)_{ijl} + (ACD)_{ikl} + (BCD)_{jkl} + (ABCD)_{IJKL} + \varepsilon_{ijklm}, \end{aligned}\tag{1}\] where: \(Y_{ijklm}\)= response variable; \(\mu\) = overall mean response; A, B, C, D= main effects of the four factors; AB, AC, AD, BC, BD, CD = two-factor interaction effect; ABC, ABD, ACD, BCD = three-factor interaction effect; ABCD= four-factor interaction effect; \(\varepsilon\) = random error term.
The silica nanoparticles extraction yield (wt.%) was calculated using Eq. 2:
\[\mathrm{Yield}\ (\%) = \frac{\mathrm{Silica\ mass}}{\mathrm{ash\ mass}\ x\ \%\ \mathrm{silica\ in\ ash}}\ x\ 100. \tag{2}\]
In the step of precipitating silica from the sodium silicate solution, the acid (type and concentration) and the gelation pH (final pH) were evaluated. The following variations were used: hydrochloric, sulfuric, and acetic acids; concentrations of 0.5 mol L\(^{-1}\), 4.0 mol L\(^{-1}\), and 8.0 mol L\(^{-1}\); final pH values equal to 2.0, 4.0, and 7.0 for hydrochloric and sulfuric acids and 4.0, 5.0, and 7.0 for acetic acid.
The characterizations of the sugarcane waste ash are reported in a previous study [19].
Semi-quantitative chemical analysis of silica samples produced with different types of acid was performed on a Shimadzu EDX-720 Energy Dispersive X-ray Fluorescence Spectrometer (EDXRF) under the following conditions: atmosphere: air; collimator: 3 mm, tube voltage of 15 kV (Na a Sc) and 50 kV (Ti a U) with tube current of 1000 \(\mu\)A and 454 \(\mu\)A, respectively, real integration time of 119 s. In samples with different synthesis parameters, the conditions were: atmosphere: air; collimator: 5 mm, tube voltage of 40 kV (Na a U) with tube current of 359 \(\mu\)A and real integration time of 120 s.
X-ray diffraction analyses (XRD) were performed using a Rigaku Multiflex diffractometer with a Cu anode using Co K\(\alpha\) radiation at 40.0 kV and 20.0 mA over the range (2\(\theta\)) of 5-80\(^{\circ}\) with a scan time of 0.5\(^{\circ}\) min\(^{-1}\).
Moisture content was determined by weighing 1 g of silica sample before and after drying at 105 \(^{\circ}\)C in an oven. Bulk density was determined by weighing 10 g of silica in a specified volume. The pH of the 5% aqueous extract was determined after contact of 0.4 g of silica with 7.6 mL of deionized water under stirring for 24 h.
UV-Vis spectra of the samples were obtained using a Varian spectrophotometer, model Cary 1E, USA utilizing quartz cuvettes with a 10.0 mm path length, and scanning samples from 200 to 800 nm.
Adsorption isotherms were performed with samples containing 0.01 g of silica in 10 mL of dye solutions with different concentrations (10 to 90 mg L\(^{-1}\) for methylene blue and 5 to 80 mg L\(^{-1}\) for crystal violet). The samples were stirred for 24 h at 25 \(^{\circ}\)C. After this time interval, an aliquot of the supernatant was separated, and the dye concentration in this solution was determined by UV-Visible spectroscopy at the wavelength corresponding to the maximum absorbance at 664 nm and 590 nm for methylene blue and crystal violet, respectively. All experiments were performed in triplicate at 25 \(^{\circ}\)C.
The Langmuir Eq. (3), Freundlich Eq. (4) and Temkin Eq. (5) nonlinear models were applied to fit the equilibrium data of the MB and CV by silica sample and the best-fit model were evaluated using the adjusted coefficient of determination (\(R^2_{\mathrm{adj}}\)) determined by Origin 2018 software [26–28]:
\[q_e = \frac{Q_{\max}.K_L.C_e}{1+K_L.C_e}, \tag{3}\]
\[q_e = K_F.C_e^{1/n_F}, \tag{4}\]
\[q_e = \frac{RT}{B}.\ln(K_T.C_e), \tag{5}\] where \(q_e\) (mg g\(^{-1}\)) is the equilibrium adsorption capacity; \(C_e\) (mg L\(^{-1}\)) is the equilibrium concentration of the adsorbate; \(Q_{\max}\) (mg g\(^{-1}\)) is the maximum monolayer adsorption capacity; \(K_L\) (L mg\(^{-1}\)) is the Langmuir constant associated with the affinity of the binding site; \(K_F\) (mg g\(^{-1}\))(L mg\(^{-1}\))\(^{1/n_F}\)) is the Freundlich constant related to adsorption capacity; \(1/n_F\) (dimensionless) is the heterogeneity fator; R is the universal gas constant (8.314 J mol\(^{-1}\) K\(^{-1}\)); T (K) is the absolute temperature; B (J mol\(^{-1}\)) is related to the heat of adsorption; \(K_T\) (L mg\(^{-1}\)) is the Temkin equilibrium binding constant.
Table 2 shows the yields obtained in the different silica syntheses with variations in temperature and time fusion, reflux time and ash: NaOH ratio of the samples. It was observed that samples from 5 to 8 presented the highest yield (87-89%). During the experiments, it was possible to observe that the samples that remained in reflux for a period of 6 h (samples 9 to 16) presented darker colors, viscous appearance and difficult filtration. The final waste also presented a different aspect from the other tests, that is, it was not a powder but a cobblestone material. In addition, the total trial period was very long. Therefore, the condition with this parameter is not feasible to obtain silica.
| Sample | Temperature (\(^{\circ}\)C) | Time (min) | ash:NaOH (w:w) | Reflux time (h) | Silica Yield (%) |
|---|---|---|---|---|---|
| 1 | 300 | 30 | 1:1 | 1 | 43.0 |
| 2 | 550 | 30 | 1:1 | 1 | 53.1 |
| 3 | 300 | 90 | 1:1 | 1 | 50.7 |
| 4 | 550 | 90 | 1:1 | 1 | 61.0 |
| 5 | 300 | 30 | 1:2 | 1 | 87.7 |
| 6 | 550 | 30 | 1:2 | 1 | 87.1 |
| 7 | 300 | 90 | 1:2 | 1 | 88.8 |
| 8 | 550 | 90 | 1:2 | 1 | 87.1 |
| 9 | 300 | 30 | 1:1 | 6 | 35.3 |
| 10 | 550 | 30 | 1:1 | 6 | 61.2 |
| 11 | 300 | 90 | 1:1 | 6 | 10.3 |
| 12 | 550 | 90 | 1:1 | 6 | 48.2 |
| 13 | 300 | 30 | 1:2 | 6 | 65.5 |
| 14 | 550 | 30 | 1:2 | 6 | 80.6 |
| 15 | 300 | 90 | 1:2 | 6 | 61.6 |
| 16 | 550 | 90 | 1:2 | 6 | 86.3 |
| 17 | 400 | 60 | 1:1.5 | 4 | 78.0 |
| 18 | 400 | 60 | 1:1.5 | 4 | 78.4 |
| 19 | 400 | 60 | 1:1.5 | 4 | 81.4 |
The statistical significance of the model and its terms was assessed by analysis of variance (ANOVA), and the results are summarized in Table 3. The studied factors were as follows: fusion temperature (A), fusion time (B), stoichiometry (C) and reflux time (D).
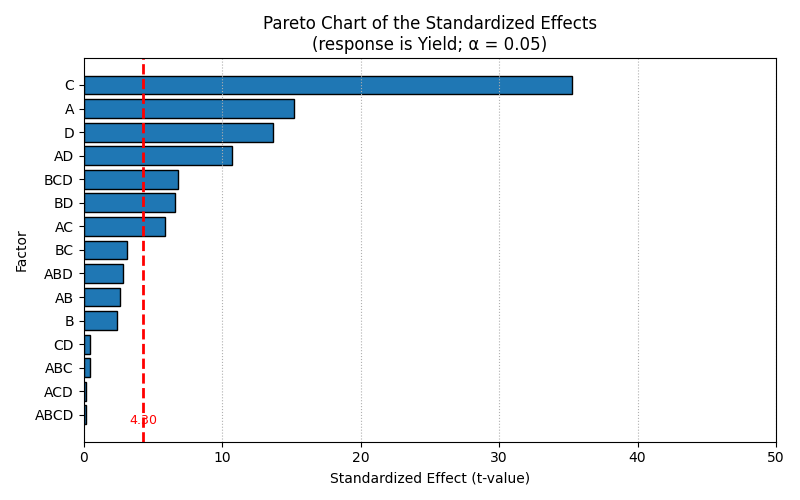
The ANOVA results indicate that the fitted model is highly significant (p \(<\) 0.001), confirming that the selected factors adequately explain the variability in silica yield. Among the main effects, the ash:NaOH ratio (C) exhibited exhibited the most pronounced effect (F = 1613.8, p \(<\) 0.001), indicating that it is the dominant variable controlling the system behavior.This behavior is consistent with the role of NaOH in promoting the conversion of silica into soluble silicates.
Factors A (F = 300.3, p \(<\) 0.01) and D (F = 243.5, p \(<\) 0.01) also showed strong statistical significance, while factor B (F = 30.8, p \(<\) 0.05) presented a comparatively smaller, yet still significant effect.
Regarding interaction effects, AD (F = 593.6, p \(<\) 0.001) and AC (F = 177.1, p \(<\) 0.01) were highly significant, suggesting that the combined influence of these factors plays a critical role in the response. Interactions BD (F = 226.9, p \(<\) 0.01), BC (F = 51.9, p \(<\) 0.05), AB (F = 34.8, p \(<\) 0.05), ABD (F = 41.1, p \(<\) 0.05) and BCD (F = 119.5, p \(<\) 0.01) are also significant, although their influence is less pronounced than that of the main effects and key two-factor interactions.
The experimental error was very low (MS = 3.08), resulting in high F-values across several terms. This indicates good experimental precision and reliability of the obtained results, strengthening confidence in the statistical significance of the identified effects. The coefficient of determination (\(R^2\) = 0.99) indicates excellent agreement between experimental and predicted values. The adjusted \(R^2\) (= 0.995) further confirms the robustness of the model, suggesting that the included terms are relevant and not overfitted. The predicted \(R^2\) (= 0.98) demonstrates good predictive capability, indicating that the model can reliably estimate silica yield within the studied experimental domain.
| Source | df | Sum of squares | Mean square | F-value | p-value |
|---|---|---|---|---|---|
| Model | 6 | 10350.0 | 1725.0 | 559.7 | \(<\)0.001 |
| A | 1 | 925.0 | 925.0 | 300.3 | \(<\)0.01 |
| B | 1 | 95.0 | 95.0 | 30.8 | \(<\)0.05 |
| C | 1 | 4968.5 | 4968.5 | 1613.8 | \(<\)0.001 |
| D | 1 | 750.0 | 750.0 | 243.5 | \(<\)0.01 |
| AB | 1 | 107.1 | 107.1 | 34.8 | \(<\)0.05 |
| AC | 1 | 545.5 | 545.5 | 177.1 | \(<\)0.01 |
| AD | 1 | 1828.4 | 1828.4 | 593.6 | \(<\)0.001 |
| BC | 1 | 160.0 | 160.0 | 51.9 | \(<\)0.05 |
| BD | 1 | 698.9 | 698.9 | 226.9 | \(<\)0.01 |
| CD | 1 | 3.8 | 3.8 | 1.2 | \(>\)0.3 |
| ABC | 1 | 3.4 | 3.4 | 1.1 | \(>\)0.3 |
| ABD | 1 | 126.6 | 126.6 | 41.1 | \(<\)0.05 |
| ACD | 1 | 1.0 | 1.0 | 0.3 | \(>\)0.5 |
| BCD | 1 | 368.2 | 368.2 | 119.5 | \(<\)0.01 |
| ABCD | 1 | 0.8 | 0.8 | 0.2 | \(>\)0.5 |
| Residual | 11 | 237.0 | 21.55 | ||
| Pure error | 2 | 6.17 | 3.08 | ||
| Total | 17 | 10587.0 | |||
| \(R^2\) | 0.990 | ||||
| Adj- \(R^2\) | 0.995 | ||||
| Pred- \(R^2\) | 0.980 |
In terms of coded variables, the complete factorial model describing silica yield is given by Eq. (6), including all main effects and interaction terms up to the fourth order.
\[\begin{aligned} Y ={}& 64.9 + 7.61A – 1.22B + 17.62C – 6.84D + 1.29AB – 2.92AC + 5.34AD \notag\\ &+ 1.58BC – 3.31BD – 0.24CD + 0.23ABC + 1.41ABD – 0.08ACD + 1.70BCD – 0.07ABCD. \end{aligned}\tag{6}\]
The analysis of regression coefficients and their 95% confidence intervals confirmed that factors A, C, and D, as well as the interactions AC, AD, and BD, are statistically significant, as their intervals do not include zero (Table 4). In contrast, B, AB, BC, CD and all higher-order interactions showed confidence intervals crossing zero, indicating negligible effects.
The Pareto chart of standardized effects (Figure 1) provides a clear visualization of the relative importance of the investigated factors on silica yield, considering a 95% confidence level (\(\alpha\) = 0.05). The vertical reference line (t = 4.30) represents the threshold for statistical significance. Also was consistently identify the ash:NaOH ratio (C) as the most influential variable affecting silica yield, followed by temperature (A) and reflux time (D).
The influence of the ash mass-NaOH volume ratio on the yield of silica from SWA was studied. The yield of silica was low (61.2 %) with ash-to-NaOH ratio of 1:5 w/v due to insufficient NaOH. The yield also was low (63.9%) with ratio of 1:10 w/v due to the lower concentration of the sodium silicate solution. An ash-to-NaOH ratio of 1:8 w/v (yield of 80.5%) was selected for the extraction of silica from bagasse ash [29].
The acidification process of silica synthesized from rice husk ash was performed using hydrochloric acid and acetic acid. The yield of the silica samples obtained was around 98–99 wt.% and the different types of acid did not show a significant difference [30].
Ash from sugarcane bagasse produced was varying combustion temperature (500–800 \(^{\circ}\)C), combustion time (2–4 h), and digestion time with 2 M NaOH. The optimal conditions resulted in a silica yield of 69.6% [31].
Silica yields of 17.91%, 9.39%, and 3.25% were obtained for rice husk, corn stalk, and sugarcane bagasse ,respectively using thermochemical process [1].
| Parameters | Estimated Coeficient | IC 95% |
|---|---|---|
| Intercept | 64.90 | (62.35 ; 67.45) |
| A | +7.61 | (5.06 ; 10.16) |
| B | \(-1.22\) | (\(-3.77\) ; 1.33) |
| C | +17.62 | (15.07 ; 20.17) |
| D | \(-6.84\) | (\(-9.39\) ; \(-4.29\)) |
| AB | +1.29 | (\(-1.26\) ; 3.84) |
| AC | \(-2.92\) | (\(-5.47\) ; \(-0.37\)) |
| AC | \(-2.92\) | (\(-5.47\) ; \(-0.37\)) |
| AD | +5.34 | (2.79 ; 7.89) |
| BC | +1.58 | (\(-0.97\) ; 4.13) |
| BD | \(-3.31\) | (\(-5.86\) ; \(-0.76\)) |
| CD | \(-0.24\) | (\(-2.79\) ; 2.31) |
| ABC | \(-0.23\) | (\(-2.78\) ; 2.32) |
| ABD | +1.41 | (\(-1.14\) ; 3.96) |
| ACD | \(-0.08\) | (\(-2.63\) ; 2.47) |
| BCD | +1.70 | (\(-0.85\) ; 4.25) |
| ABCD | \(-0.07\) | (\(-2.62\) ; 2.48) |
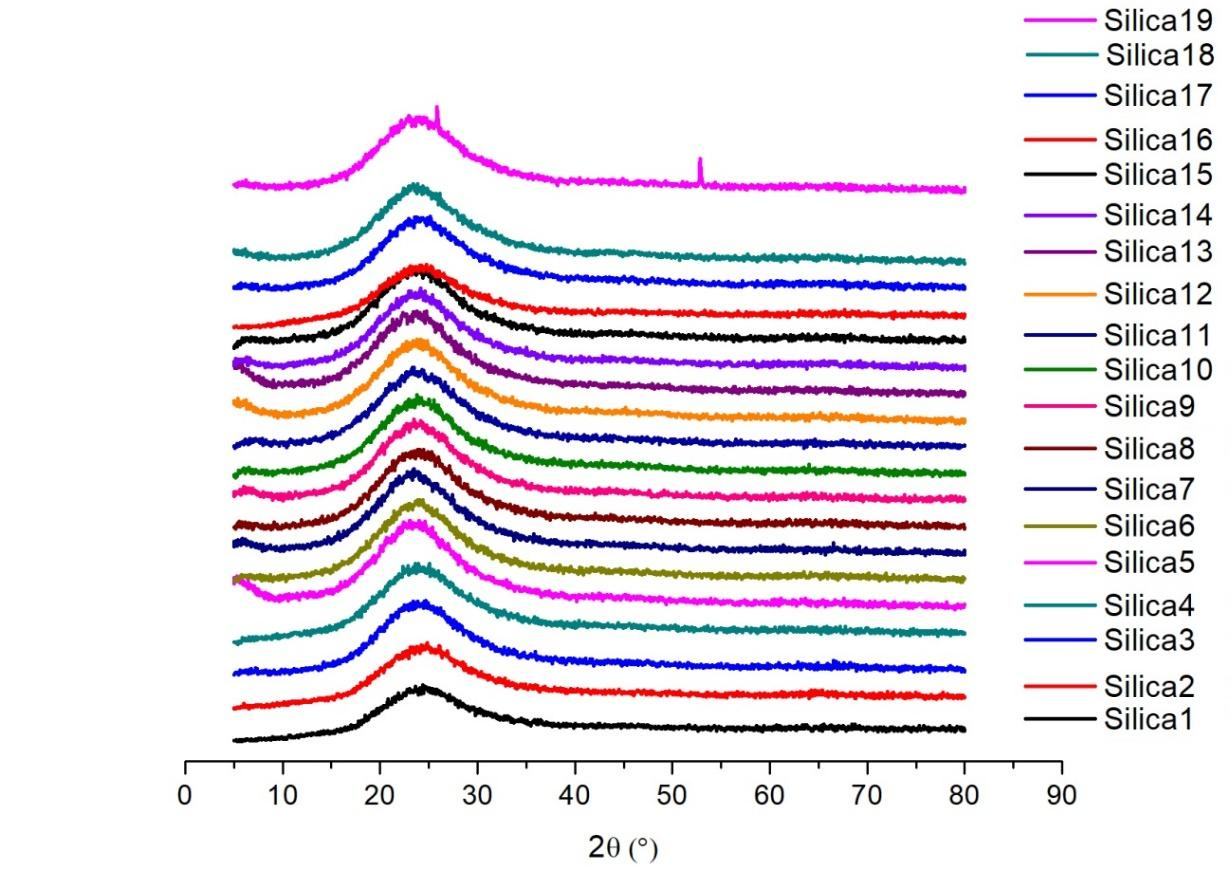
The XRD analysis of synthesized silica samples are presented in Figure 2. The results show for all samples a hump at 2\(\theta\) between 15-30\(^{\circ}\) with a centered peak value at 2\(\theta\) = \(\sim\)22\(^{\circ}\) corresponding to the formation of amorphous silica according to standard patterns of silica (JCPDS-card # 96-412-4080). The main XRD peak for amorphous silica remains fixed in position regardless of the synthesis route [13,20]. Other small peaks detected are characteristic of the presence of sodium choride as an impurity that formed in the precipitation of silica with HCl.
The chemical composition of silica samples produced with the highest yield are shown in Table 5 (Table 2: samples 5 to 8 and 17 to 19). Under all conditions it was possible to obtain high purity silica (\(\sim\)96 to 97%).
| Component | Content ( % by mass) | ||||||
|---|---|---|---|---|---|---|---|
| 5 | 6 | 7 | 8 | 17 | 18 | 19 | |
| SiO\(_2\) | 96.413 | 96.567 | 96.393 | 95.675 | 96.215 | 96.394 | 95.597 |
| SO\(_3\) | 1.563 | 1.519 | 1.405 | 1.700 | 1.763 | 1.728 | 1.669 |
| Fe\(_2\)O\(_3\) | 1.535 | 1.492 | 1.787 | 2.003 | 1.527 | 1.375 | 2.076 |
| TiO\(_2\) | 0.325 | 0.410 | 0.322 | 0.540 | 0.407 | 0.360 | 0.418 |
| BaO | 0.075 | – | 0.079 | – | – | – | – |
| CaO | 0.044 | – | – | 0.060 | 0.064 | 0.072 | 0.181 |
| CuO | 0.022 | – | – | – | – | – | – |
| K\(_2\)O | – | – | – | – | – | 0.052 | – |
| MnO | 0.019 | 0.012 | 0.013 | 0.018 | 0.025 | 0.020 | 0.019 |
| ZrO\(_2\) | 0.004 | – | – | 0.003 | – | – | 0.040 |
The effectiveness of different acids (types and concentrations) and final pH during the precipitation stage of silica synthesis process was determined comparing the final mass (Table 6). The silica sample selected for this evaluation was obtained under the optimal conditions identified as: ash: NaOH = 1:2 by mass; fusion temperature = 300 \(^{\circ}\)C; fusion time = 30 min and reflux time = 1 h. This silica sample was among those with higher yield and lower energy cost.
Analyzing the Table 6, it can be noted that in terms of silica mass production, the performance of strong acids (hydrochloric acid and sulfuric acid) and weak acid (acetic acid) was similar. In the case of acetic acid, silica precipitation did not occur at an acid concentration of 0.5 mol L\(^{-1}\) at any final pH. Precipitation was also effective in quantities similar to HCl and H\(_2\)SO\(_4\) only at the highest concentrations (4 and 8 mol L\(^{-1}\)) at final pH of 5.0 or 7.0.
The same behavior was observed in a previous study. Three acid pretreatments and acid precipitation with HCl, HNO\(_3\), and H\(_2\)SO\(_4\) were used to optimize the process for maximum silica extraction from sugarcane bagasse ash. The yield of nanosilica practically was not affected by the type of acid. The value were 3.2 g, 3.0 g, and 2.97 g for HCl, HNO\(_3\), and H\(_2\)SO\(_4\), respectively [18].
The chemical composition of the silica samples obtained under the different conditions of acid precipitation and final pH (listed in the Table 6) is shown in Tables 7, 8 and 9. Under all conditions it was possible to obtain high purity silica (\(\sim\)94 to 97%).
| Acid | Concentration (mol L\(^{-1}\)) | Final pH | Silica mass (g) |
|---|---|---|---|
| HCl | |||
| 1 | 0.5 | 2 | 1.424 |
| 2 | 8.0 | 2 | 1.760 |
| 3 | 0.5 | 4 | 1.697 |
| 4 | 8.0 | 4 | 1.699 |
| 5 | 4.0 | 7 | 1.760 |
| H\(_2\)SO\(_4\) | |||
| 1 | 0.5 | 2 | 1.511 |
| 2 | 8.0 | 2 | 1.525 |
| 3 | 0.5 | 4 | 1.569 |
| 4 | 8.0 | 4 | 1.681 |
| 5 | 4.0 | 7 | 1.634 |
| CH\(_3\)COOH | |||
| 1 | 8.0 | 5.0 | 1.686 |
| 2 | 4.0 | 7.0 | 1.830 |
Nanosilica was synthesized utilizing rice husks from Southwest Aceh, Indonesia employing sol-gel method, under varying calcining temperature and precipitating agents (HCl and HNO\(_3\)). The results indicated the maximum values of silica yield of 51.98 % and 95 % purity was obtained with HNO\(_3\) [32].
Table 10 shows the results of the determination of moisture, apparent density, and the pH of a 5% aqueous suspension (or extract) of silica samples obtained under different acid precipitation conditions.
The moisture content of precipitated silica refers to the amount of water present in the silica particles, typically expressed in percentage by weight and its value varies depending on the manufacturing process and the intended use of the silica material. Generally, the moisture content of precipitated silica ranges from 0.5% to 8.0%, with most products having a moisture content of 2-4%. The moisture content of the silica samples (1.2–7.0%) falls within the typical range for commercial silica.
The apparent density is the density of the body formed by the packing of elementar silica particles and it changes with the type of the packing [33]. The apparent density value of silica is directly related to particle size and surface roughness, because these properties affects particle packing and the porosity of the material. Smaller particles and rougher surfaces tend to create larger intergranular spaces, resulting in lower apparent density, while larger, smoother particles generally result in denser packing and higher apparent density. The density of the samples ranged from 0.1511 to 0.494 g cm\(^{-3}\). The apparent density of commercial precipitated silica is often reported within the range of 0.12 to 0.30 g/cm\(^3\). It was observed that the lower the precipitation pH and the lower the acid concentration, the higher the apparent density value. Highly acidic conditions (pH 2) promote the formation of more stable, denser gels with smaller particle sizes and stronger interactions, compared to the more dispersed and less dense particles formed at neutral or moderately acidic pH values like 4 or 7 [34,35].
The exact pH of a sample of precipitated silica will depend on a number of factors. Commercial silica is frequently adjusted to a near-neutral pH range (typically 5–8) to optimize its stability, safety, and inert behavior. Table 10 shows that the final pH of precipitated silica was in the range from acidic to alkaline depending on specific precipitation conditions (acid concentration and precipitation pH). Higher precipitation pH, resulted in a higher pH of aqueous silica extract.
| Oxides | Content (% in mass) | ||||
|---|---|---|---|---|---|
| Sample 1 | Sample 2 | Sample 3 | Sample 4 | Sample 5 | |
| SiO\(_2\) | 95.721 | 96.513 | 96.526 | 96.170 | 95.717 |
| SO\(_3\) | 2.115 | 1.514 | 1.598 | 1.476 | 1.733 |
| Fe\(_2\)O\(_3\) | 1.564 | 1.509 | 1.478 | 1.417 | 1.717 |
| TiO\(_2\) | 0.477 | 0.398 | 0,398 | 0.346 | 0.396 |
| BaO | 0.122 | – | – | 0.095 | – |
| CaO | – | 0.036 | – | 0.151 | 0.266 |
| CuO | – | 0.020 | – | – | – |
| MnO | – | 0.010 | – | 0.045 | 0.049 |
| Er\(_2\)O\(_3\) | – | – | – | 0.286 | – |
| ZnO | – | – | – | 0.011 | 0.009 |
| ZrO\(_2\) | – | – | – | 0.004 | – |
| K\(_2\)O | – | – | – | – | 0.112 |
| Oxides | Content (% in mass) | ||||
|---|---|---|---|---|---|
| Sample 1 | Sample 2 | Sample 3 | Sample 4 | Sample 5 | |
| SiO\(_2\) | 97.238 | 95.870 | 96.051 | 94.395 | 93.790 |
| SO\(_3\) | 1.371 | 3.570 | 1.778 | 3.500 | 3.716 |
| Fe\(_2\)O\(_3\) | 0.871 | 0.181 | 1.747 | 1.573 | 1.771 |
| TiO\(_2\) | 0.483 | 0.358 | 0.425 | 0.400 | 0.416 |
| CaO | – | – | – | 0.086 | 0.139 |
| CuO | 0.028 | 0.018 | – | – | – |
| MnO | – | – | – | 0.037 | 0.049 |
| Er\(_2\)O\(_3\) | – | – | – | – | – |
| ZnO | – | – | – | 0.008 | 0.010 |
| ZrO\(_2\) | 0.008 | 0.003 | – | – | – |
| K\(_2\)O | – | – | – | – | 0.110 |
| Oxides | Content (% in mass) | |
|---|---|---|
| Sample 1 | Sample 2 | |
| SiO\(_2\) | 95.190 | 95.433 |
| SO\(_3\) | 2.413 | 1.897 |
| Fe\(_2\)O\(_3\) | 1.792 | 1.866 |
| TiO\(_2\) | 0.386 | 0.439 |
| BaO | 0.064 | – |
| CaO | 0.099 | 0.233 |
| MnO | 0.047 | 0.052 |
| ZnO | 0.009 | 0.012 |
| K\(_2\)O | – | 0.068 |
| Acid | Concentration (mol L\(^{-1}\)) | Final pH | Moisture content (%) | Aparent density (g cm\(^{-3}\)) | pH of the aqueous extract |
|---|---|---|---|---|---|
| HCl | |||||
| 1 | 0.5 | 2 | 3.6 | 0.3436 | 4.6 |
| 2 | 8.0 | 2 | 5.1 | 0.1582 | 5.7 |
| 3 | 0.5 | 4 | 4.4 | 0.2815 | 5.2 |
| 4 | 8.0 | 4 | 1.7 | 0.1645 | 9.3 |
| 5 | 4.0 | 7 | 3.7 | 0.1511 | 10.8 |
| H\(_2\)SO\(_4\) | |||||
| 1 | 0.5 | 2 | 7.1 | 0.478 | 4.6 |
| 2 | 8.0 | 2 | 7.5 | 0.244 | 3.4 |
| 3 | 0.5 | 4 | 1.2 | 0.494 | 5.8 |
| 4 | 8.0 | 4 | 1.5 | 0.195 | 7.8 |
| 5 | 4 | 7 | 1.4 | 0.242 | 9.4 |
| CH\(_3\)COOH | |||||
| 1 | 8.0 | 5 | 8.2 | 0.244 | 8.0 |
| 2 | 4.0 | 7 | 2.1 | 0.215 | 10.8 |
The synthesized silica sample that exhibited properties closest to those of commercial silica was obtained under the following conditions: ash:NaOH ratio = 1:2 by mass; fusion temperature = 300 \(^{\circ}\)C; fusion time = 30 min; reflux time = 1 h; and precipitation with 8 mol L\(^{-1}\) H\(_2\)SO\(_4\) until a final pH of 4. This silica sample was used for evaluating the removal of dyes from aqueous solution.
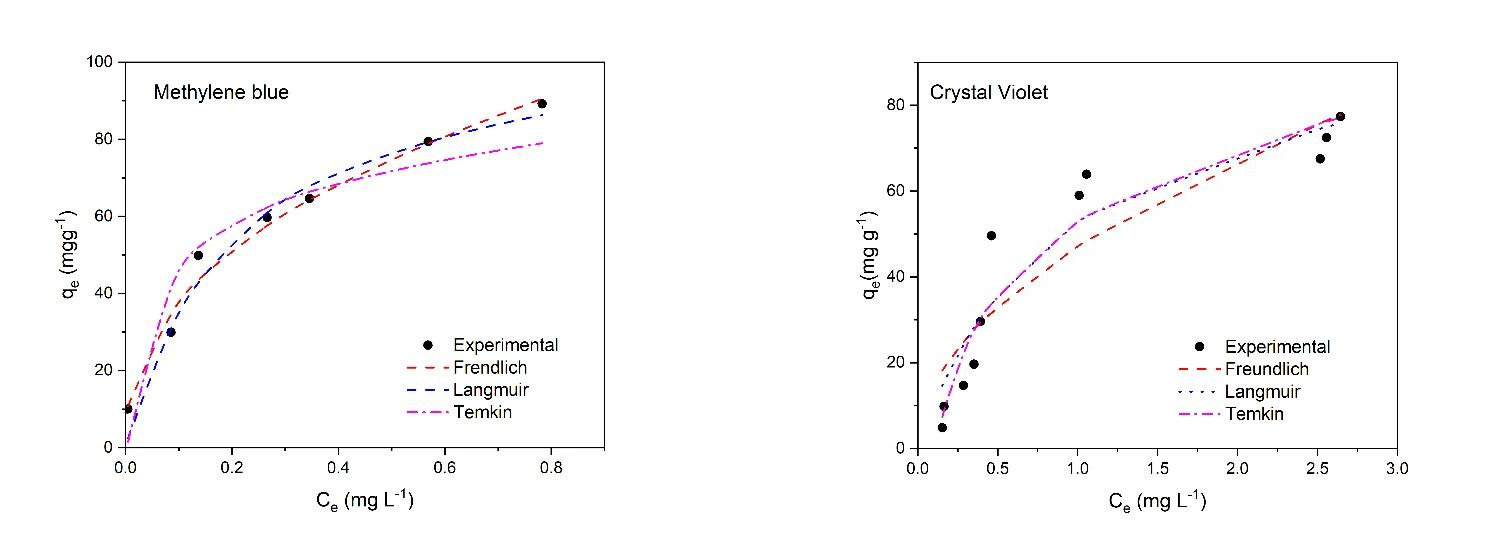
The comparison of nonlinear fitted curves from experimental data and Langmuir, Freundlicha nd Temkin isotherm models are shown in Figure 3. The removal percentage was around 96 and 100% for MB and 97 and 99% for CV. The coefficients of determination and the isotherm parameters from the nonlinear regressive method are listed in Table 11.
The maximum monolayer adsorption capacity was found to be 108.4 mg g\(^{-1}\) for MB and 102.0 mg g\(^{-1}\) for CV, confirming that silica sample has a strong affinity for both dyes, with a higher uptake capacity for MB. These findings suggest that silica sample can function as an efficient adsorbent for dye-laden wastewater.
The results shown in Table 11 indicated that the Freundlich model for methylene blue and the Temkin model for crystal violet presented the best values for the statistical parameters of fit evaluation (highest value of the adjusted coefficient of determination). This fact indicates that multilayer formation of methylene blue on silica and monolayer formation for crystal violet occurred.
The adsorption mechanisms of dyes on silica have been suggested to be electrostatic interaction and hydrogen bonding. The electrostatic interaction between the cationic dye molecule and the negatively charged silanol (Si–O\(^{-}\)) surface groups was considered the main mechanism [36].
It was demonstrated that the MB dye adsorption occurred via the formation of two layers on surfaces of nano-silica prepared from rice husk [37].
| MB | CV | |
|---|---|---|
| LANGMUIR | ||
| \(Q_{\max}\) (mg g\(^{-1}\)) | 108.4 | 102.0 |
| \(K_L\) (L mg\(^{-1}\)) | 4.98 | 1.09 |
| \(R^2_{\mathrm{ajust}}\) | 0.9663 | 0.8938 |
| FREUNDLICH | ||
| \(K_F\) (mg g\(^{-1}\))( L mg\(^{-1}\))\(^{1/n_F}\)) | 100.2 | 47.3 |
| \(1/n_F\) | 0.413 | 0.512 |
| \(R^2_{\mathrm{ajust}}\) | 0.9790 | 0.8224 |
| TEMKIN | ||
| RT/B | 15.0 | 24.5 |
| \(K_T\) (L mg\(^{-1}\)) | 246.9 | 8.77 |
| \(R^2_{\mathrm{ajust}}\) | 0.8746 | 0.9153 |
The values of the maximum adsorption capacity according to the Langmuir model (\(Q_{\max}\)) for methylene blue (MB) and crystal violet (CV) on silica, obtained in this work, are compared with results for silica-based adsorbents found in the literature in Table 12 and Table 13, respectively.
| Adsorbent | \(Q_{\max}\) (mg g\(^{-1}\)) | Reference |
|---|---|---|
| Silica gel supported dinitro calix[4]arene cage | 212.770 | 38 |
| Mesoporous silica derived from coal ash | 323.62 | 36 |
| Silica from bagasse ash | 37.34 | 13 |
| Mesoporous silica from bagasse ash | 14.16 | 25 |
| Silica nano-sheets derived from vermiculite | 12.66 | 39 |
| Mesoporous silica structures SBA-3 | 285.7 | 40 |
| Silica aerogel prepared from bagasse ash | 20.8333 | 41 |
| Silica prepared from bagasse ash | 108.4 | This study |
| Adsorbent | \(Q_{\max}\) (mg g\(^{-1}\)) | Reference |
|---|---|---|
| Amino-functionalized silica | 40.0 | 42 |
| Poly \(\beta\)-cyclodextrin supported by nanosilica | 34.5 | 43 |
| Rice husk nanosilica | 42.0 | 44 |
| Silica prepared from bagasse ash | 117.98 | 14 |
| Mesocellular silica foam | 6.6 | 45 |
| Silica xerogel | 1.59 | 46 |
| Silica modified with sodium dodecyl sulfate | 25.80 | 46 |
| Silica prepared from bagasse ash | 102.0 | This study |
The synthesis of silica by sol gel process using various parameters generated nanoparticles with high yield (87-89%) and purity (96 to 97%). NPs synthesis was optimized by \(2^4\) factorial design and the factor that most influenced the yield of silica synthesis in the alkaline fusion step was the ash:NaOH ratio. In the acid precipitation step, the amount of silica obtained with hydrochloric or sulfuric acid was similar at all concentrations and gelation pH, while acetic acid results were sensitive to concentration and final pH. Synthesized silica exhibited comparable properties to commercial silica and demonstrated to be an efficient, sustainable, and low-cost adsorbent for the removal of the cationic dyes MB and CV from aqueous solutions. The results indicate that it was possible to obtain a desired adsorbent from a renewable source, with a low cost and with an easy and fast synthesis procedure. This approach aligns with the circular economy by repurposing waste into a high-value material, consistent with Sustainable Development Goal 12, specifically 12.5.
Acknowledgments: The authors acknowledge the COSAN S.A (São Paulo, Brazil) for supplying the sugarcane waste ash. We would also like to thank Dr Santos, J.J. and Dr. Rovani, S. for collaboration. We are also thankful to Conselho Nacional de Desenvolvimento Científico e Tecnológico-Brazil (CNPq).