
In recent decades, diabetes mellitus (DM) has emerged as a major global health challenge, with a substantial increase in the number of affected individuals and a corresponding rise in healthcare demands worldwide [1–3]. Diabetes is a metabolic disorder characterised by insufficient insulin secretion, impaired insulin action, or a combination of these abnormalities, resulting in elevated blood glucose concentrations (hyperglycaemia) [4,5]. Insulin, a hormone secreted by pancreatic \(\beta\)-cells, plays a central role in maintaining glucose homeostasis by regulating cellular glucose uptake and metabolic processes [6]. Persistent hyperglycaemia can cause damage to several vital organs, including the kidneys, liver, heart, eyes and peripheral nerves [7,8]. Diabetes is commonly classified as type 1 diabetes mellitus (T1DM), type 2 diabetes mellitus (T2DM), or gestational diabetes mellitus [9–11]. T2DM, historically termed non-insulin-dependent diabetes mellitus (NIDDM), represents approximately 90–95% of diagnosed diabetes cases [12]. It is characterised by insulin resistance, accompanied by progressive or inadequate pancreatic insulin secretion and persistently elevated blood glucose levels [13]. By contrast, T1DM is primarily associated with autoimmune destruction of pancreatic \(\beta\)-cells, leading to severe insulin deficiency; it accounts for a smaller proportion of diabetes cases [14]. Gestational diabetes mellitus arises during pregnancy when insulin secretion cannot adequately compensate for pregnancy-associated insulin resistance [15,16]. Common clinical symptoms of diabetes include frequent urination, excessive thirst, fatigue, and, in some individuals, the presence of glucose in the urine [17,18]. If glycaemic control remains inadequate over an extended period, diabetes can be associated with serious complications, including visual impairment, cardiovascular disease, peripheral neuropathy, diabetic ulcers, stroke and diabetic nephropathy [19,20]. Studies of the molecular mechanisms of diabetes have identified several potential therapeutic pathways, and currently approved treatments are accompanied by continuing clinical investigations of additional candidate compounds [21,22]. Nevertheless, the diversity of metabolic pathways implicated in diabetes and the possibility of adverse drug effects present considerable difficulties for developing a single treatment capable of addressing every manifestation of the disease [8].
Aldose reductase (AR) is an enzyme in the polyol pathway that catalyses the NADPH-dependent conversion of glucose to sorbitol [23]. Under normal cellular conditions, glucose is also metabolised through glycolysis to yield pyruvate, which can subsequently enter aerobic energy-producing pathways, including the tricarboxylic acid cycle [24]. In conditions of prolonged hyperglycaemia, increased glucose availability can enhance flux through the polyol pathway, contributing to redox imbalance and related metabolic disturbances [25]. Excessive AR-associated pathway activity has been linked to diabetic complications such as neuropathy, retinopathy, oxidative stress and renal extracellular-matrix changes [26,27]. Another diabetes-associated enzyme, 11\(\beta\)-hydroxysteroid dehydrogenase type 1 (11\(\beta\)-HSD1), catalyses the conversion of inactive cortisone to active cortisol in an NADPH-dependent process, providing a further avenue for metabolic investigation [28]. Diacylglycerol O-acyltransferase 1 (DGAT1) is a membrane-associated enzyme that catalyses the formation of triacylglycerol (TAG) from diacylglycerol (DAG) and fatty acyl-CoA, contributing to lipid storage and metabolism [29]. Because altered lipid metabolism frequently accompanies T2DM, inhibition of TAG synthesis through DGAT1 has been investigated as a possible strategy for addressing metabolic dysfunction [30]. Dasatinib is primarily an antineoplastic tyrosine kinase inhibitor; its use as a docking comparator in this work should therefore be interpreted as a computational reference rather than as an established standard antidiabetic treatment.
Recent computational investigations have evaluated natural products and synthetic molecules in relation to diabetes-associated molecular targets, frequently combining molecular docking, density functional theory (DFT), and pharmacokinetic prediction methods. Akinyede et al. examined the antidiabetic properties of aqueous acetone extracts of Helichrysum petiolare using in vitro assays and molecular docking of constituents identified through liquid chromatography–mass spectrometry [31]. Their analysis included interactions with \(\alpha\)-amylase and \(\alpha\)-glucosidase, with reported docking scores of approximately \(-7.2\) to \(-9.6\) kcal/mol for \(\alpha\)-amylase and \(-7.3\) to \(-9.0\) kcal/mol for \(\alpha\)-glucosidase. The study indicated potentially useful enzyme interactions, although docking predictions and extract-based assays should not be treated as clinical proof of efficacy. Bitew et al. investigated sixteen naturally occurring antidiabetic flavonoids using in silico ADMET estimation, DFT calculations and molecular docking [32]. Their results included predicted pharmacokinetic differences among chrysin, wogonin, genistein, baicalein and apigenin, with reported values for gastrointestinal absorption and bioavailability varying across the examined compounds. In the reported comparison, chrysin showed an absorption value of 84.6%, while the value cited for metformin was 78.3%. The authors also discussed frontier-orbital-related descriptors and molecular docking interactions with \(\alpha\)-amylase; the reported docking scores for chrysin, apigenin and kaempferol ranged approximately from \(-7.5\) to \(-8.3\) kcal/mol, compared with \(-4.5\) kcal/mol for metformin. These computational comparisons provide a basis for further experimental investigation but do not directly establish therapeutic effectiveness. Omiyale et al. subsequently investigated phytochemicals from Annona muricata, employing docking, ADMET and DFT analyses of proteins associated with T2DM [33]. The study reported favourable calculated affinities for phenolic constituents such as taxifolin, robinetin and genistein, as well as acetogenins including murihexocin C and gigantetronenin. Reported binding scores included \(-12.03\) kcal/mol for taxifolin, \(-11.84\) kcal/mol for robinetin, and DGAT1 docking scores of \(-14.75\) and \(-14.59\) kcal/mol for the named acetogenins. The authors also considered predicted oral absorption, drug-likeness, toxicity and electronic reactivity; in particular, the high molecular weights of some acetogenins raised concerns about absorption and drug-like characteristics. Collectively, these investigations illustrate the opportunities offered by integrated computational screening, alongside the importance of independent biochemical and pharmacological validation.
Despite these advances, diabetes remains a substantial cause of morbidity and mortality, and additional research into molecular interactions and possible therapeutic strategies is warranted. Accordingly, the present work investigates \(^1\)H-cyclopenta[c]furan-3(3aH)-one, 6,6a-dihydro-1-(1,3-dioxolan-2-yl)-, (3aR,1-trans,6a-cis) (CDD) and tetraacetyl-D-xylonic nitrile (TAN) as compounds of potential relevance to diabetes-related molecular targets and glucose metabolism. Density functional theory was employed to examine their optimised geometries, frontier molecular orbitals, electron distributions and related descriptors. Molecular docking simulations were then undertaken to predict ligand–protein interactions, binding scores and possible intermolecular contacts. In addition, ADMET predictions were performed to assess physicochemical attributes and potential absorption, distribution, metabolism, excretion and toxicity liabilities. Such predictions can inform subsequent experimental prioritisation but cannot ensure the safety or therapeutic efficacy of either compound.
Although CDD and TAN have been discussed in relation to chemical constituents and their broader biological contexts, an integrated assessment of their electronic structure, docking behaviour and predicted pharmacokinetic properties against the selected diabetes-associated targets has not been comprehensively established. The present study therefore compares these compounds using a coordinated computational approach. Importantly, the selected targets differ substantially in biological function and their direct relevance to blood-glucose control. Thus, the findings are intended as exploratory molecular-interaction predictions rather than as evidence that either compound inhibits glucose itself or can already serve as an antidiabetic drug.
Methanol (99.8% purity, HPLC grade) was obtained from SD Fine Limited, and distilled water with a reported conductivity of 2 \(\mu\)S/cm and a pH range of 5.3–7 was used. Raw leaf powder of Moringa oleifera, sourced from India, was selected for the extract-related experimental component of the study; this plant species is widely cultivated in tropical and subtropical regions. High-purity 2,2-diphenyl-1-picrylhydrazyl (DPPH), supplied by SRL Pvt. Ltd., was used to evaluate free-radical-scavenging activity.
Separate 5% suspensions of Moringa oleifera leaf powder were prepared in methanol and distilled water. Each suspension was continuously stirred at 45–50 \(^\circ\)C for 8 h, after which the mixture was filtered through Whatman filter paper to separate the solid plant material from the liquid extract. This filtration step prepared the extracts for the subsequent analytical procedures described in the study.
The phytochemical composition of the Moringa oleifera leaf extract was examined using a GC–MS system (Agilent Technology-5977MSD), loaded with an HP-5MS capillary column (30 m \(\times\) 0.25 mm ID \(\times\) 0.25 \(\mu\)m), which contained about 5% diphenyl and 95% dimethylpolysiloxane. Electron-impact ionisation was carried out at 70 eV, and helium of 99.99% purity was used as the carrier gas at a constant flow rate of 1 mL/min. A split ratio of 50:1 was maintained, and the sample injection volume was 1 \(\mu\)L. The ion-source temperature was maintained at 250 \(^\circ\)C, while the reported injector temperature was 60 \(^\circ\)C. Mass spectra were acquired at an ionisation energy of 70 eV, and the relative abundance of each detected constituent was estimated by comparing its chromatographic peak area with the total integrated peak area. Chromatographic profiles and spectral information were processed using MassHunter software, with the resulting assignments interpreted in the context of the recorded mass spectra.
Putative phytochemical constituents were assigned using their mass-spectral fragmentation patterns, relative peak areas and retention times. These assignments were compared with the National Institute of Standards and Technology (NIST) mass-spectral library (NIST11.LIB); such library matches provide tentative identifications unless independently confirmed using authentic standards.
The free-radical-scavenging potential and antioxidant properties of aqueous and methanolic Moringa oleifera leaf extracts were evaluated using the DPPH assay. A methanolic DPPH solution (1.52 \(\times\) 10\(^{-4}\) M) was mixed with each concentration of the plant extract at a 1:1 ratio. Following incubation for 30 min, the absorbance of the resulting solution was recorded at 517 nm to assess the extent of radical scavenging. Control mixtures were prepared by combining the DPPH solution with water or methanol at a 1:1 ratio, and their absorbance values were measured at 517 nm under the same assay conditions. The IC\(_{50}\) value, defined as the extract concentration required to produce 50% inhibition of the DPPH signal, was also calculated. A higher IC\(_{50}\) indicates comparatively weaker free-radical-scavenging activity, whereas a lower value indicates greater activity under the specified assay conditions.
The extract preparation, phytochemical screening and DPPH procedures above are described as an experimental component separate from the CDD/TAN calculations. Numerical extract-yield, GC–MS and DPPH results are not included in the supplied Results section; their relation to the selection and chemical identity of CDD and TAN should be documented from the original laboratory records before any causal claims are drawn.
Density functional theory (DFT) calculations were performed on the study compounds (CDD and TAN) to identify their reactivity and stability against the targeted proteins. The \(\omega\)B97XD functional with the 6-311++G(2d,2p) basis set was employed to optimise the molecular geometries of the studied compounds and characterise their calculated electronic properties. The Gaussian 09 software package [34] was used to perform the quantum-chemical calculations, while molecular structures were drawn, inspected and visualised using GaussView 6.0.16 [35]. Geometry optimisation was undertaken to examine calculated equilibrium molecular structures, with particular attention to bond lengths, bond angles and the geometrical features of the resulting conformations. Frontier Molecular Orbital (FMO) analysis provides insights into the reactivity of the compounds by evaluating their energy gaps along with other quantum descriptors. Consequently, the HOMO and LUMO isosurfaces of the compounds were visualised using Chemcraft 1.0 [36]. Molecular electrostatic potential (MESP) maps were also generated to identify regions of relatively positive and negative electrostatic potential, while natural population analysis (NPA) was used to investigate atomic charge distributions and the electronic characteristics of each molecule. Weak interaction regions were examined using non-covalent interaction (NCI) analysis, and reduced density gradient (RDG) plots were generated using Multiwfn 3.7 [37]. These visualisations provide a qualitative means of interpreting weak attractive interactions and steric repulsion.
Additionally, Fourier Transform Infrared Spectroscopy (FT-IR) analysis was carried out to characterise different functional groups present in the study compounds, giving clear insight into structural stability and bond strength across different atoms. Distinct proton (\(^1H\)) and carbon-13 (\(^{13}C\)) chemical shifts in the compounds were explored under Nuclear Magnetic Resonance (NMR) Spectroscopy. Here, the NMR chemical shift calculations were performed using the Gauge-Including Atomic Orbital (GIAO) method, which is the standard approach for computing NMR shielding tensors in DFT calculations. The polarizable continuum model (PCM) was employed to represent implicit solvent effects, with chloroform (CDCl\(_3\)) selected as the solvent for the calculated NMR shielding parameters. These computed values were intended to provide a basis for interpretation in relation to commonly used NMR experimental conditions. Tetramethylsilane (TMS) was used as the computational reference for the \(^1\)H and \(^{13}\)C chemical shifts, with its shielding constants calculated at the same theoretical level as those of the compounds under investigation. Molecular docking was employed to predict ligand–protein binding poses, relative scoring-function values, and potential contacts within the selected receptor regions. These calculated interactions are not equivalent to measured biological inhibition. Subsequent ADMET profiling was undertaken to estimate absorption, distribution, metabolism, excretion and toxicity properties, enabling an exploratory assessment of potential pharmacokinetic and safety-related limitations. These parameters were measured using online data servers such as ADMETlab 2.0 [38], SwissADME [39], and ProTox-II version 3.0 [40].
PDB entry 5EE7 is an X-ray crystallographic structure determined at a resolution of 2.50 Å of the human glucagon receptor (GCGR) in complex with the antagonist MK-0893 [41]. GCGR is a class B G protein-coupled receptor (GPCR) predominantly expressed on hepatocytes, as well as in the kidneys, adipose tissue, heart, and pancreas. An important structural feature of this complex is that MK-0893 binds to a completely novel allosteric site-an extrahelical pocket between transmembrane helices 6 (TM6) and 7 (TM7), extending toward the lipid environment—rather than the canonical orthosteric site within the seven-transmembrane helical bundle. This binding mode provides structural insight into the modulation of a class B G protein-coupled receptor and identifies a site that may be examined in structure-guided studies.
The glucagon receptor occupies a central regulatory position in glucose homeostasis, particularly through its contribution to the regulation of hepatic glucose output. Glucagon, secreted by pancreatic \(\alpha\)-cells, activates hepatic GCGR to stimulate glycogenolysis and gluconeogenesis, thereby increasing hepatic glucose output. In type 2 diabetes, glucagon signalling is often inappropriately elevated, contributing to both fasting and postprandial hyperglycemia. Consequently, glucagon-receptor antagonism has been investigated as a possible therapeutic strategy for lowering blood glucose in selected metabolic contexts. The allosteric binding site revealed in 5EE7 provides a unique opportunity for structure-based drug design; targeting this site with novel GCGR antagonists could yield compounds with a completely new mechanism of action and enhanced selectivity for the treatment of diabetes.
The 6JXR structure represents the human T-cell receptor (TCR)–CD3 complex, which includes the CD3 gamma (CD3G) subunit [42]. CD3G is involved in T-cell receptor signalling and immune-cell activation. Its inclusion provides a structural target for investigating the interaction of tetra-acetyl-D-xylonic nitrile with an immune-related protein associated with diabetes mellitus. In this study, 6JXR was selected to explore the possible interaction of the test compound with CD3G at the molecular level. The docking analysis may provide preliminary insight into the binding affinity and interaction profile of the compound with an immune-signalling protein, complementing the investigation of its potential relevance in diabetes mellitus.
PDB entry 7SYD contains the epidermal growth factor receptor (EGFR) and represents the cryo-electron microscopy structure of the full-length human EGFR extracellular domain in complex with EGF, at a resolution of 3.10 Å [43]. EGFR is a receptor tyrosine kinase that initiates intracellular signalling through the binding of extracellular ligands such as EGF and TGF-\(\alpha\). This structure reveals the extracellular module adopting a “tips-juxtaposed” dimeric conformation upon EGF engagement, providing an atomic-level view of the molecular mechanisms underlying EGFR ligand-dependent signal output. The cryo-EM structure provides information about the arrangement of the receptor extracellular region and the associated ligand-binding interfaces. Its suitability for a given structure-based drug-design protocol depends on which receptor site and inhibitory mechanism are being investigated.
In the pathophysiology of diabetes, chronic hyperglycemia induces advanced glycation end-products (AGEs) and oxidative stress, which can aberrantly activate EGFR in various cell types, including renal podocytes, mesangial cells, and vascular smooth muscle cells. This aberrant activation promotes the development and progression of diabetic nephropathy, retinopathy, and cardiomyopathy by driving cellular hypertrophy, extracellular matrix accumulation, inflammation, and fibrosis. Therefore, targeting EGFR not only holds promise for modulating glucose metabolism but may also mitigate the micro-and macrovascular complications of diabetes. The ligand-bound conformation captured in 7SYD offers a structural basis for examining extracellular EGFR contacts, but it does not directly represent the intracellular kinase active site targeted by conventional EGFR kinase inhibitors. Any potential role of compounds selected through this structure in preventing diabetes-associated complications would require independent mechanistic and biological validation.
PDB entry 8HB0 is a 2.90 Å resolution cryo-EM structure of human SGLT2 in complex with the accessory protein MAP17 and the inhibitor TA1887 [44]. SGLT2, encoded by the SLC5A2 gene, is an electrogenic sodium/sugar cotransporter primarily expressed in the proximal convoluted tubule of the kidney, where it reabsorbs approximately 90% of filtered glucose from the glomerular filtrate back into the bloodstream. This structure illustrates contacts between the inhibitor and SGLT2 in an outward-facing conformation, providing a structural basis for examining substrate transport and inhibitory mechanisms at the transporter.
SGLT2 is one of the most clinically validated therapeutic targets for type 2 diabetes mellitus (T2DM). In the diabetic state, glucose reabsorption capacity is significantly upregulated, exacerbating persistent hyperglycemia. SGLT2 inhibitors (e.g., canagliflozin, dapagliflozin, empagliflozin) lower blood glucose in an insulin-independent manner by blocking renal glucose reabsorption and promoting glucosuria. Furthermore, clinically approved members of this drug class have demonstrated cardiovascular and renal benefits in appropriate patient populations beyond their blood-glucose-lowering effects. The binding mode of TA1887 in 8HB0 offers a clear pharmacophore framework for virtual screening, enabling the design of novel SGLT2 inhibitors with potentially improved selectivity and/or superior safety profiles.
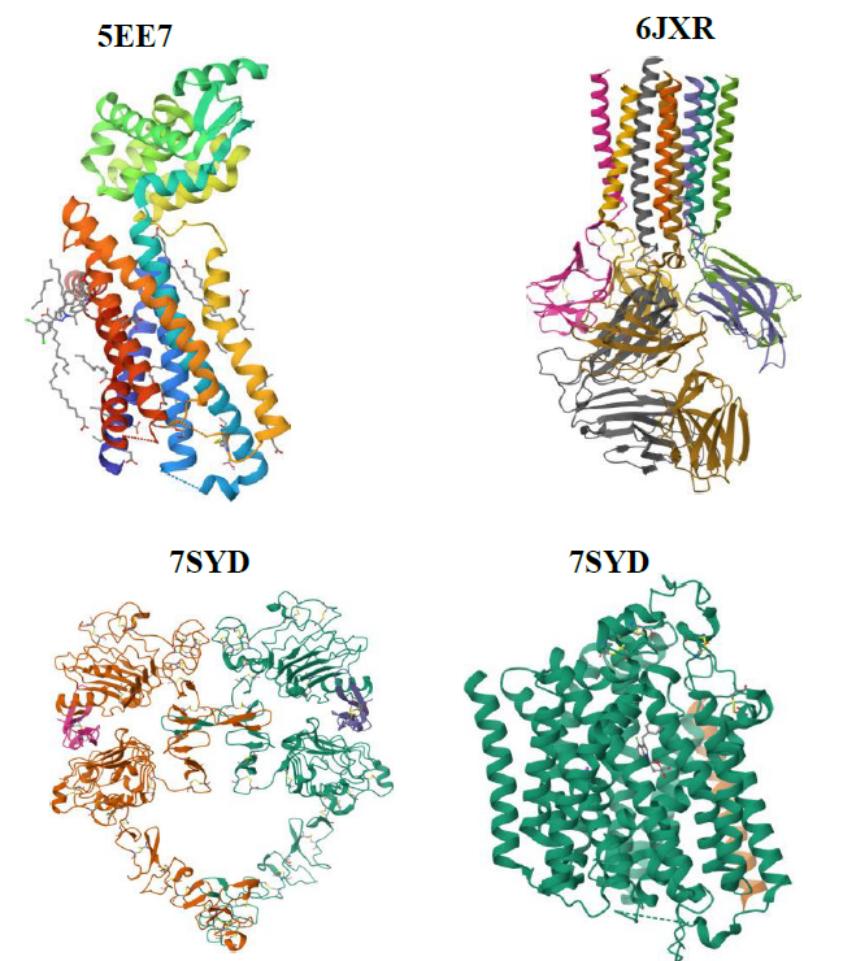
First, the selected target structures (5EE7, 6JXR, 7SYD and 8HB0), shown in Figure 1, were retrieved from the Protein Data Bank (https://www.rcsb.org/) [45]. Each protein was prepared by removing the native ligands, heteroatoms, and water molecules to prevent interference with the results. Polar hydrogen atoms were subsequently added as part of receptor preparation to establish a consistent docking representation. This was carried out with the aid of Biovia Discovery Studio software version 2021 [46]. The prepared receptor structures were then imported into the PyRx docking environment [47] and processed as macromolecular receptor files with the charge assignments required by the selected docking workflow. The investigated compounds CDD and TAN, together with dasatinib, which was obtained from DrugBank for comparison [48], were imported into PyRx, subjected to the reported minimisation procedure, converted into PDBQT format and docked individually against the selected receptor structures. The calculated scores and residue-contact summaries were tabulated, and two- and three-dimensional ligand–protein interactions were examined using BIOVIA Discovery Studio Visualizer and PyMOL, respectively [49].
In this section, the optimised molecular configurations of the studied compounds were examined to describe their computed geometries and identify characteristic distances and angles. Both the positional relationships of the constituent atoms and the resulting bond parameters were considered in interpreting the structures. Data are presented in Table 1. The selected CDD bond assignments include H\(_{26}\)–C\(_{14}\), C\(_{13}\)–O\(_{12}\), C\(_4\)–C\(_6\), O\(_1\)–C\(_5\), and C\(_6\)–C\(_7\), corresponding to bond lengths of 1.093 Å, 1.426 Å, 1.507 Å, 1.386 Å, and 1.341 Å, respectively. For TAN, the selected bond assignments include O\(_{15}\)–C\(_{14}\), H\(_{29}\)–C\(_{13}\), C\(_2\)–C\(_3\), N\(_{10}\)–C\(_1\), O\(_7\)–C\(_{17}\), O\(_{21}\)–C\(_{20}\), and C\(_4\)–C\(_6\), corresponding to the bond lengths of 1.198 Å, 1.094 Å, 1.433 Å, 1.152 Å, 1.379 Å, 1.197 Å, and 1.539 Å, respectively. The observed short bond lengths are indicative of the structural stability of the optimised compounds.
| Compounds | Bond label | Bond length | Bond angles label | Bond angles length |
| CDD | H\(_{26}\)–C\(_{14}\) | 1.093 Å | H\(_{26}\)–C\(_{14}\)–O\(_{10}\) | 109.546 |
| C\(_{13}\)–O\(_{12}\) | 1.426 Å | C\(_{13}\)–O\(_{12}\)–C\(_{11}\) | 104.758 | |
| C\(_4\)–C\(_6\) | 1.507 Å | C\(_4\)–C\(_6\)–C\(_7\) | 107.905 | |
| O\(_1\)–C\(_5\) | 1.386 Å | O\(_1\)–C\(_5\)–O\(_9\) | 121.937 | |
| C\(_6\)–C\(_7\) | 1.341 Å | C\(_6\)–C\(_7\)–C\(_8\) | 112.649 | |
| TAN | O\(_{15}\)–C\(_{14}\) | 1.198 Å | O\(_{15}\)–C\(_{14}\)–C\(_{16}\) | 124.447 |
| H\(_{29}\)–C\(_{13}\) | 1.094 Å | H\(_{29}\)–C\(_{13}\)–H\(_{28}\) | 109.196 | |
| C\(_2\)–C\(_3\) | 1.433 Å | C\(_2\)–O\(_3\)–C\(_{11}\) | 116.701 | |
| N\(_{10}\)–C\(_1\) | 1.152 Å | N\(_{10}\)–C\(_1\)–C\(_2\) | 176.912 | |
| O\(_7\)–C\(_{17}\) | 1.379 Å | O\(_7\)–C\(_{17}\)–O\(_{18}\) | 117.022 | |
| O\(_{21}\)–C\(_{20}\) | 1.197 Å | O\(_{21}\)–C\(_{20}\)–C\(_{22}\) | 124.859 | |
| C\(_4\)–C\(_6\) | 1.539 Å | C\(_4\)–C\(_6\)–C\(_8\) | 116.346 |
The molecular representations of CDD and TAN, which assist in identifying the atom labels and structural fragments discussed above, are shown in Figure 2.
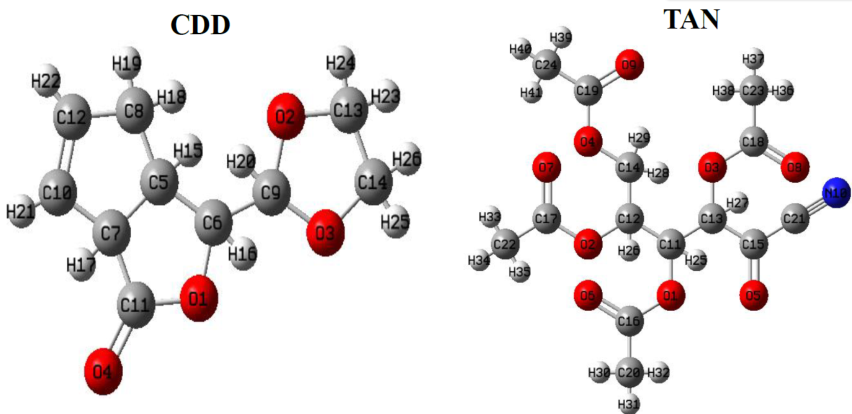
Table 2 presents the computed HOMO and LUMO energies, energy gaps and related quantum-chemical descriptors for CDD and TAN. The corresponding HOMO–LUMO isosurfaces, which illustrate the spatial distributions of the frontier molecular orbitals, are shown in Figure 3. The HOMO energies were calculated to be \(-7.53\) eV for CDD and \(-8.11\) eV for TAN, whereas the LUMO energies were \(-3.08\) and \(-2.09\) eV, respectively. These values produce HOMO–LUMO gaps of 4.45 eV for CDD and 6.02 eV for TAN. The smaller gap for CDD suggests a relatively softer electronic response under the approximations of this DFT comparison, while the larger gap for TAN suggests greater resistance to changes in electronic occupation. In conceptual DFT, molecular electronic hardness and softness are useful descriptive quantities, although they should not be interpreted as independent demonstrations of biological activity or experimentally determined chemical stability [50].
| Compounds | HOMO | LUMO | Eg | \(\chi\) | \(\eta\) | \(\sigma\) | \(\omega\) | \(\mu\) |
| (eV) | (eV) | (eV) | (eV) | (eV) | (eV-1) | (eV) | (eV) | |
| CDD | -7.53 | -3.08 | 4.45 | 5.305 | 2.225 | 0.225 | 6.324 | -5.305 |
| TAN | -8.11 | -2.09 | 6.02 | 5.100 | 3.010 | 0.166 | 4.321 | -5.100 |
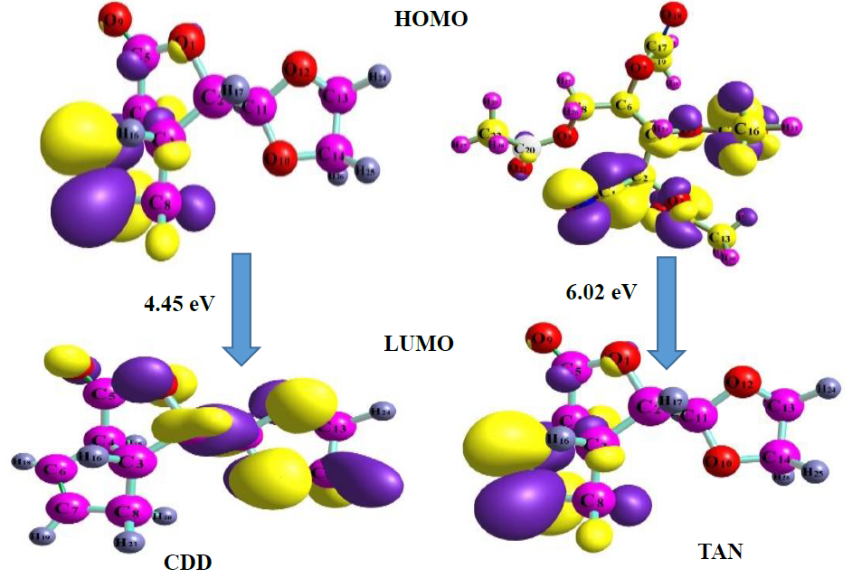
The calculated ionisation-potential estimates derived from the negative HOMO energies were 7.53 eV for CDD and 8.11 eV for TAN, with the larger value for TAN indicating a greater estimated energy requirement for electron removal within the adopted approximation. The electrophilicity index (\(\omega\)), describing a molecule’s tendency to accept electronic charge under the conceptual DFT model, was 6.324 eV for CDD and 4.321 eV for TAN. The corresponding chemical-softness values (\(\sigma\)) were 0.225 and 0.166 eV\(^{-1}\), while the hardness values (\(\eta\)) were 2.225 and 3.010 eV, respectively. Calculated electronegativities (\(\chi\)) were 5.305 eV for CDD and 5.100 eV for TAN, with chemical potentials (\(\mu\)) of \(-5.305\) and \(-5.100\) eV. Together, these descriptors provide a comparison of electronic properties that may influence molecular interactions. Their relevance to the binding and functional behaviour of the compounds should nevertheless be assessed through the receptor-specific docking calculations and appropriate experimental studies.
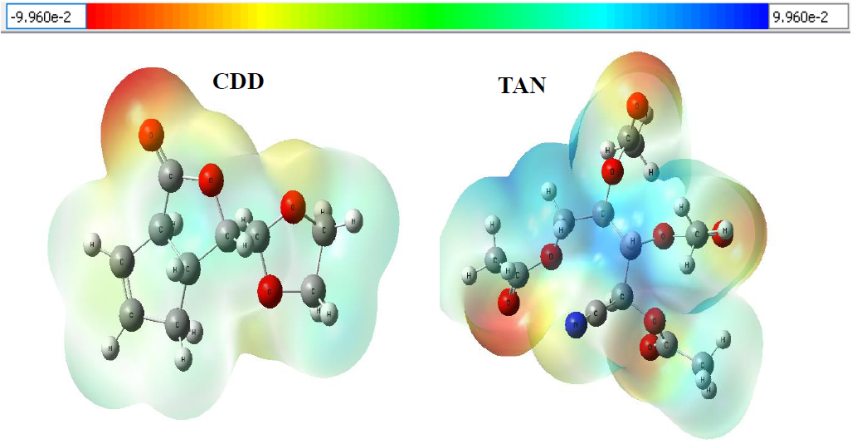
Molecular electrostatic potential analysis reveals distinct calculated electrostatic potential distributions for CDD and TAN, as illustrated in Figure 4. Red/orange regions denote electron-rich sites, while blue indicates electron-deficient areas. CDD shows pronounced negative potential around oxygen atoms, favouring electrophilic interactions and hydrogen bonding, with neutral green regions reflecting lower electrostatic reactivity. TAN exhibits a more heterogeneous distribution, with negative regions near oxygen-containing groups and positive potential around the nitrile region. These complementary reactive sites suggest both compounds can engage in intermolecular interactions with biological macromolecules. Therapeutically, oxygen-rich negative regions may facilitate hydrogen bonding with amino acid residues in protein binding pockets, aiding ligand recognition and binding stability. TAN’s stronger electrostatic differentiation may further influence its protein interaction patterns. Overall, MESP results provide an electronic basis for interpreting subsequent molecular docking and support further computational evaluation of CDD and TAN as biologically relevant compounds.
Natural population analysis (NPA) was performed to evaluate charge distribution across the studied compounds. The discussion focuses primarily on oxygen atoms and selected carbon and nitrogen atoms, because their atomic-charge characteristics may influence intermolecular electrostatic contacts and the distribution of electron density within each compound. The natural population of individual atoms in the core electrons, natural charge, valence electrons and total electrons of CDD and TAN are presented in Table 3.
| Compound | Atom | Natural charge | Core electrons | Valence electrons | Total electrons |
| CDD | O10 | -0.595 | 1.999 | 6.574 | 8.595 |
| O12 | -0.581 | 1.999 | 6.561 | 8.581 | |
| C13 | -0.059 | 1.999 | 4.039 | 6.059 | |
| C14 | -0.059 | 1.999 | 4.039 | 6.059 | |
| O9 | -0.556 | 1.999 | 6.542 | 8.555 | |
| C6 | -0.186 | 1.999 | 4.166 | 6.186 | |
| C7 | -0.170 | 1.999 | 4.152 | 6.170 | |
| O1 | -0.543 | 1.999 | 6.524 | 8.543 | |
| TAN | O15 | -0.549 | 1.999 | 6. 538 | 8.549 |
| O18 | -0.550 | 1.999 | 6.538 | 8.550 | |
| O21 | -0.550 | 1.999 | 6.538 | 8.550 | |
| C22 | -0.706 | 1.999 | 4.700 | 6.706 | |
| C19 | -0.709 | 1.999 | 4.702 | 6.709 | |
| C16 | -0.714 | 1.999 | 4.707 | 6.713 | |
| N10 | -0.308 | 1.999 | 5.287 | 7.308 |
In CDD, the oxygen atoms \(O_1\), \(O_9\), \(O_{10}\) and \(O_{12}\) exhibit comparatively negative calculated natural charges of \(-0.543\), \(-0.556\), \(-0.595\) and \(-0.581\), respectively, as summarised in Table 3. These values indicate an uneven distribution of electron density among the oxygen-containing regions of the molecule and identify sites that may participate in electrostatic and hydrogen-bonding interactions when appropriately positioned relative to a binding partner. The tabulated valence-electron populations are approximately 6.5 electrons for these oxygen atoms, consistent with their comparatively electron-rich character in the adopted population-partitioning scheme. The corresponding carbon atoms \(C_6\), \(C_7\), \(C_{13}\) and \(C_{14}\) have natural charges of \(-0.186\), \(-0.170\), \(-0.059\) and \(-0.059\), respectively. Their valence-electron populations are near 4.0, reflecting the different electronic environments of the carbon framework and the partial redistribution of electron density within the structure. These calculated charge values represent properties of the selected quantum-chemical model and should not be equated directly with formal oxidation states or measured charges.
For TAN, the oxygen atoms \(O_{15}\), \(O_{18}\) and \(O_{21}\) display natural charges of \(-0.549\), \(-0.550\) and \(-0.550\), respectively, which are broadly similar to the oxygen charges calculated for CDD. The carbon atoms \(C_{16}\), \(C_{19}\) and \(C_{22}\) are assigned more negative values of \(-0.714\), \(-0.709\) and \(-0.706\), respectively, whereas the nitrile-associated nitrogen atom \(N_{10}\) has a natural charge of \(-0.308\). Its calculated valence-electron population is approximately 5.29 electrons. These differences suggest that electron density is distributed unevenly across TAN’s oxygenated carbon skeleton and nitrogen-containing group. The comparative pattern of calculated atomic charges may therefore contribute to differences in electrostatic potential, local polarisation and the positions at which intermolecular contacts are favoured. However, predicted atomic charges alone cannot establish whether the compounds will bind strongly or selectively to biological receptors; such conclusions require detailed interaction analysis and independent validation.
Non-covalent interaction (NCI) analysis was used to visualise regions associated with weak attractive contacts and steric repulsion in the calculated electron-density distributions. Figure 5 presents the corresponding NCI isosurfaces for CDD and TAN. Red regions are generally interpreted as sterically repulsive interactions, whereas green regions indicate relatively weak, attractive interactions of a van der Waals character [51,52]. The colours therefore describe features of the plotted interaction indicator rather than directly quantifying an experimentally observed binding constant or the therapeutic suitability of the compounds. Because no external protein environment is present in the isolated-molecule plots, the resulting surfaces should principally be interpreted in relation to the intramolecular geometry and electronic properties of each investigated ligand.
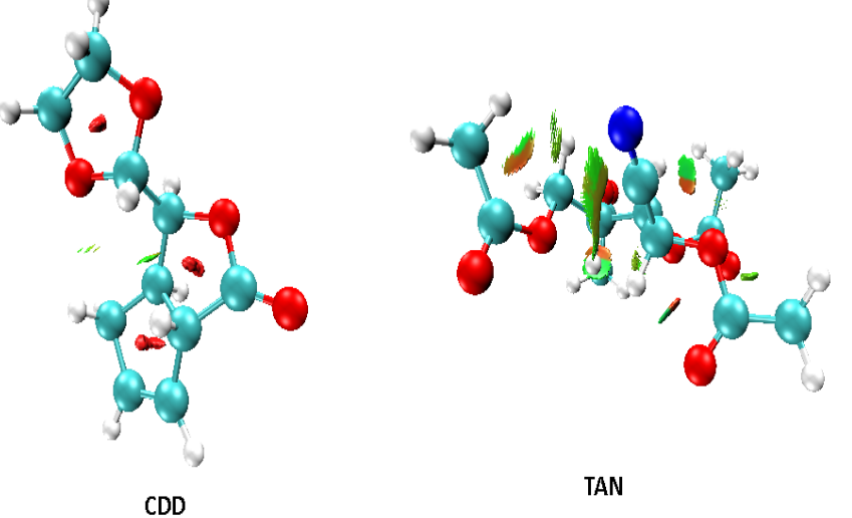
In the CDD structure, the plots show a combination of sterically repulsive regions and relatively limited green isosurface areas. These features may arise from the spatial arrangement of the cyclopenta[c]furan ring system and other portions of the molecule, and they suggest that local crowding should be considered when assessing accessible conformations. However, such local steric features are not necessarily detrimental in every binding environment; depending on pocket shape and ligand orientation, they could influence both conformational preference and selectivity. For TAN, the green NCI regions are more prominent, suggesting a greater contribution from weak attractive interactions within the computed structural arrangement. These observations provide complementary information to the calculated electrostatic potential and population-analysis results. Nevertheless, they do not demonstrate that TAN is biologically compatible or that its complexes with diabetes-associated proteins will be stable in solution. The relationship between these qualitative NCI patterns and the binding scores should be explored through receptor-specific interaction analyses and, ultimately, experimental validation.
The calculated vibrational results provide additional information about the molecular structures, functional-group characteristics and the frequencies associated with selected normal modes. Here, considering the 6-311++G(2d,2p) basis set employed in this work, the scaling value applied for correcting the calculated vibrational frequencies is 0.957. This factor was applied to the calculated frequencies for comparison with the reported reference values, although its suitability for the selected functional and basis set should be verified. Data for the studied compounds are presented in Table 4, comparing both the theoretical and experimental values.
| Compound | Theoretical | Reported comparison values | |||
| Frequency | Infrared | Frequency | Infrared | Assignment | |
| CDD | 1861.23 | 529.171 | 1745 | – | Symmetry CO |
| 2962.31 | 1861.2359.179 2963 | – | Symmetry CH | ||
| 3030.31 | 18.872 | 3028 | – | Symmetry CH | |
| 3099.68 | 22.147 | 3093 | – | Symmetry CH | |
| 3121.82 | 22.689 | 3111 | – | Symmetry CH | |
| TAN | 1838.19 | 339.397 | 1745 | – | Symmetry CO |
| 2355.58 | 3.349 | 2345.58 | – | Symmetry CN | |
| 3104.46 | 4.420 | 3111 | – | Anti-symmetry CH2 | |
| 3049.27 | 0.199 | 3050 | – | Symmetry CH3 | |
The carbonyl (C=O) stretching frequencies provide an important indicator of the electronic environments of the carbonyl functional groups within CDD and TAN. Table 4 lists calculated frequencies of 1861.23 cm\(^{-1}\) for CDD and 1838.19 cm\(^{-1}\) for TAN, together with a comparison value of 1745 cm\(^{-1}\) for each compound. The underlying spectral assignments, the distinction between computed and comparison data, and the effect of the scaling factor require careful verification when interpreting the two sets of frequencies. The difference between the calculated and comparison values should not automatically be interpreted as proof of experimental agreement or molecular stability without validating the calculation outputs and the provenance of the corresponding measured spectra.
The investigated compounds also display multiple calculated carbon–hydrogen stretching modes associated with their different aliphatic and unsaturated structural fragments. For CDD, the frequencies listed in Table 4 include 2962.31, 3030.31, 3099.68 and 3121.82 cm\(^{-1}\). The comparison column additionally contains values of 3028, 3093 and 3111 cm\(^{-1}\) and an incompletely formatted entry associated with the 2962.31 cm\(^{-1}\) mode. These entries indicate the need to verify the source calculations and experimental measurements before assigning individual frequencies conclusively. In general, variations in calculated C–H stretching frequencies reflect differences in local bonding environments, and comparison with measured vibrational bands can provide evidence for functional-group assignments when the data and units are correctly documented.
For TAN, the frequency listed at 2355.58 cm\(^{-1}\) is assigned to a carbon–nitrogen stretching vibration associated with the nitrile functionality. The corresponding comparison value in Table 4 is 2345.58 cm\(^{-1}\). An assignment of this band to an oxime or imine C–N vibration would not correspond to the proposed nitrile group; the present discussion therefore associates the reported mode with the C\(\equiv\)N bond of TAN. Confirmation using the underlying calculated normal mode and an independently recorded reference spectrum is needed to establish the accuracy of the assignment. Such validation is particularly important when comparing calculated harmonic frequencies with experimentally observed infrared absorption bands.
Calculated nuclear magnetic resonance (NMR) chemical shifts for the two investigated compounds are summarised in Table 5. The calculated proton (\(^1\)H) and carbon-13 (\(^{13}\)C) chemical shifts reveal different electronic environments across the studied structures. For CDD, the lactone-containing ring system is associated with a relatively deshielded carbonyl carbon, assigned a calculated \(^{13}\)C chemical shift of 174.837 ppm. Additionally, predicted proton chemical shifts at 6.279 and 6.173 ppm, together with \(^{13}\)C shifts at 145.589 and 135.273 ppm, are consistent with unsaturated, sp\(^2\)-hybridised structural environments associated with the proposed ring system. The cyclic framework was further supported by methane (3.351 ppm) and methylene protons (2.586, 2.528 and 2.293 ppm), with corresponding \(^{13}\)C chemical shifts of 84.741, 55.039 and 54.518 ppm, which are associated with carbon environments in the proposed structures. Calculated proton shifts from 4.151 to 3.708 ppm are associated with the 1,3-dioxolan-2-yl substituent, while \(^{13}\)C shifts of 105.901, 69.102 and 67.983 ppm support the proposed acetal and ether-linked oxygen environments. The assignments remain computational and should be confirmed by comparison with experimentally acquired spectra.
| Compound | Scaffold | Chemical shift (ppm) \(^1H\) | Chemical shift (ppm) \(^{13}C\) |
| CDD | Cyclopenta[c]furan-3(3aH)-one | 6.279 | 174.837 |
| 6.173 | 145.589 | ||
| 3.351 | 135.273 | ||
| 2.586 | 84.741 | ||
| 2.528 | 55.039 | ||
| 2.293 | 54.518 | ||
| 5.098 | 34.153 | ||
| 1,3-Dioxolan-2-yl substituent | 4.151 | 105.901 | |
| 4.151 | 69.102 | ||
| 4.134 | 67.983 | ||
| 3.851 | |||
| 3.758 | |||
| 3.708 | |||
| TAN | D-xylose (backbone) | 6.191 | 85.037 |
| 4.455 | 80.324 | ||
| 4.377 | 69.173 | ||
| 4.288 | 58.398 | ||
| 3.855 | – | ||
| Tetra acetyl group | 2.482 | 173.622 | |
| 2.215 | 173.194 | ||
| 2.178 | 171.980 | ||
| 2.133 | 171.341 | ||
| 2.057 | 19.628 | ||
| 1.982 | 19.327 | ||
| 1.959 | 19.281 | ||
| 1.926 | 19.219 | ||
| 1.920 | – | ||
| 1.849 | – | ||
| 1.828 | – | ||
| 1.799 | – | ||
| Nitrile Group | – | 121.159 |
TAN portrays a profoundly different spectral profile because of the D-xylose backbone, multiple acetyl groups, and a noticeable nitrile moiety. A highly oxygenated sugar framework is reflected in \(^1H\) chemical shifts specifically at 6.191 ppm, 4.455 ppm, and 4.377 ppm, which was further supported by \(^{13}C\) chemical shifts at 85.037 ppm, 80.324 ppm, and 69.173 ppm; these observed chemical shifts confirm the pentose sugar structure. \(^{13}C\) signals at 58.398 ppm and a corresponding \(^1H\) shift between 2.482 and 1.799 ppm, alongside \(^{13}C\) chemical shifts within 173.622 -171.341 ppm, confirm the presence of the carbonyl (C=O) groups within acetyl esters. The nitrile (\(-\)C\(\equiv\)N) group was assigned a \(^{13}\)C signal at 121.159 ppm in Table 5, without a corresponding proton signal in the \(^1H\) spectrum, consistent with the assignment of an sp-hybridised nitrile carbon within the proposed molecular structure.
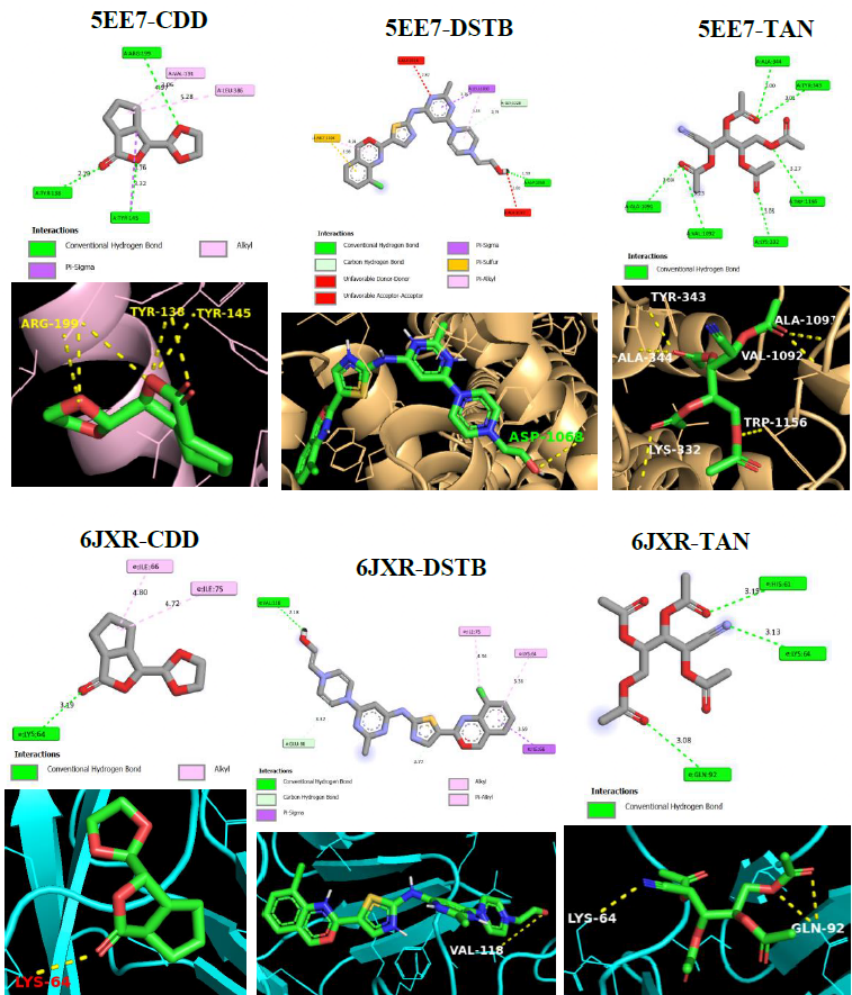
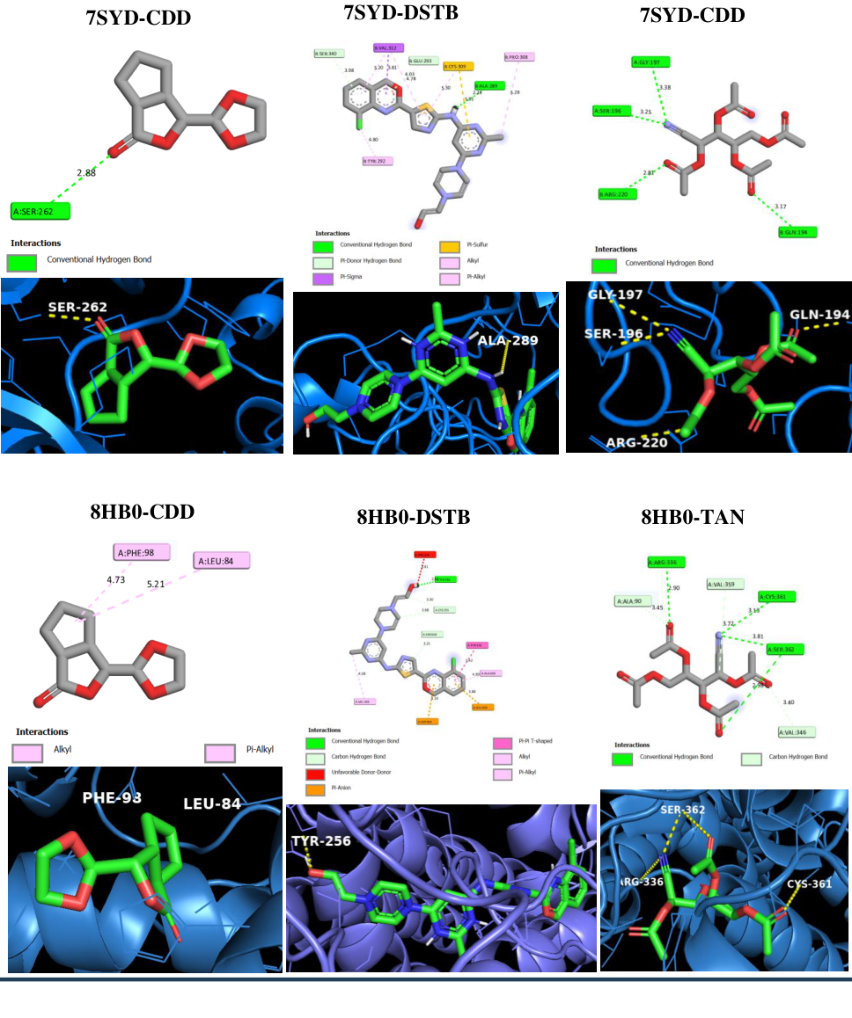
Molecular docking was conducted to compare the predicted binding affinities of CDD and TAN, to identify potential ligand–residue contacts, and to examine the positions of the ligands within the selected receptor regions of structures 5EE7, 6JXR, 7SYD and 8HB0. The resulting docking scores and poses provide model-dependent estimates that may guide subsequent functional assays, rather than direct demonstrations of inhibitory activity against diabetes-related targets. The calculated binding affinities and reported ligand–residue contacts are listed in Table 6, while the docking-grid parameters are given in Table 7. The two- and three-dimensional visualisations of the reported complexes are provided in Figures 6 and 7. For the 5EE7 glucagon receptor structure, the docking calculations yielded binding affinities of \(-7.5\) kcal/mol for CDD and \(-5.6\) kcal/mol for TAN. The corresponding interaction diagrams report conventional hydrogen bonds and other intermolecular contacts at the stated residue distances, including contacts involving oxygen-containing portions of the ligands. These patterns are consistent with the predicted poses but do not demonstrate their stability under physiological conditions. Dasatinib (DSTB), included as a comparator, produced a more negative predicted score of \(-9.3\) kcal/mol and a reported contact with ASP-1068 at a distance of 1.99 Å. Residue identity, atom-to-atom distance and receptor-chain numbering must be validated using the original docked coordinate files, particularly for contacts assigned unusually long distances.
| Ligand-Protein Interaction | Binding Affinity (kcal/mol) | Conventional Hydrogen Bond | H-Bond Distance (Å) |
| 5EE7-CDD | -7.5 | TYR-138 | 2.70 |
| TYR-145 | 3.32 | ||
| ARG-199 | 4.97 | ||
| 5EE7-TAN | -5.6 | LYS-332 | 3.05 |
| TYR-343 | 3.01 | ||
| ALA-344 | 3.00 | ||
| ALA-1091 | 3.03 | ||
| VAL-1092 | 3.23 | ||
| TRP-1156 | 3.27 | ||
| 5EE7-DSTB | -9.3 | ASP-1068 | 1.99 |
| 6JXR-CDD | -4.9 | LYS-64 | 3.19 |
| 6JXR-TAN | -4.4 | HIS-61 | 3.19 |
| LYS-64 | 3.13 | ||
| GLN-92 | 3.08 | ||
| 6JXR-DSTB | -7.1 | VAL-118 | 2.18 |
| 7SYD-CDD | -6.4 | SER-262 | 2.88 |
| 7SYD-TAN | -6.0 | GLN-194 | 3.17 |
| SER-196 | 3.25 | ||
| GLY-197 | 3.38 | ||
| ARG-220 | 2.81 | ||
| 7SYD-DSTB | -9.1 | ALA-289 | 2.24 |
| 8HB0-CDD | -6.8 | — | |
| 8HB0-TAN | -6.1 | ARG-336 | 2.90 |
| CYS-361 | 3.13 | ||
| SER-362 | 2.98, 3.81 | ||
| 8HB0-DSTB | -9.6 | TYR-256 | 2.10 |
For the 6JXR T-cell receptor–CD3 complex, CDD gave a predicted docking affinity of \(-4.9\) kcal/mol, with a reported contact involving LYS-64 at 3.19 Å. TAN gave a docking score of \(-4.4\) kcal/mol and was associated with reported contacts involving HIS-61, LYS-64 and GLN-92 at 3.19, 3.13 and 3.08 Å, respectively. Dasatinib yielded a more negative value of \(-7.1\) kcal/mol, with the reported VAL-118 contact at 2.18 Å. These results are consistent with the values presented in Table 6; however, their relevance to glucose homeostasis requires a specific biological rationale because this structure primarily participates in T-cell receptor signalling rather than directly catalysing glucose metabolism.
For 7SYD, the predicted docking affinities were \(-6.4\), \(-6.0\) and \(-9.1\) kcal/mol for CDD, TAN and dasatinib, respectively. The reported residue-contact pattern for TAN includes GLN-194, SER-196, GLY-197 and ARG-220, while CDD and dasatinib were each assigned one conventional hydrogen-bond contact, involving SER-262 and ALA-289, respectively. The longer or less favourable distances among some of the listed contacts should be independently reviewed before all entries are described as conventional hydrogen bonds. The 7SYD structure represents an EGFR extracellular-domain complex; consequently, binding at this site should not be equated with inhibition of the intracellular kinase domain.
For 8HB0, the reported docking affinity of CDD was \(-6.8\) kcal/mol, with alkyl and \(\pi\)–alkyl interactions noted rather than conventional hydrogen bonds. TAN yielded a value of \(-6.1\) kcal/mol and reported contacts with ARG-336, CYS-361 and SER-362, while dasatinib produced a docking score of \(-9.6\) kcal/mol and a TYR-256 contact at 2.10 Å. The corresponding predicted binding poses are illustrated in Figures 6 and 7. In this set of results, dasatinib consistently showed more negative docking scores than the two studied compounds, but the comparison does not validate it as a diabetes treatment or demonstrate that any of these ligands inhibits the selected targets experimentally. Accordingly, the molecular docking findings are best regarded as exploratory hypotheses that warrant verification of receptor preparation, docking-grid placement, residue numbering and experimental target engagement.
| CENTER | SIZE (Å) | |||||
| PROTEIN | X | Y | Z | X | Y | Z |
| 5EE7 | -12.2612 | 3.4455 | -30.9474 | 51.7575 | 60.8025 | 86.8990 |
| 6JXR | 147.8255 | 166.628 | 165.8792 | 52.5648 | 33.6035 | 65.2929 |
| 7SYD | 161.778 | 160.586 | 165.2857 | 70.9858 | 127.9881 | 114.0773 |
| 8HB0 | 68.7121 | 67.4469 | 69.5497 | 62.6574 | 63.5790 | 77.4694 |
Absorption, distribution, metabolism, excretion and toxicity (ADMET) predictions were used to assess the potential pharmacokinetic and safety-related characteristics of CDD and TAN. The resulting model outputs are presented in Table 8. These estimates were generated computationally and should therefore be distinguished from pharmacokinetic measurements in animals or humans. In particular, classification colours, probability scores and threshold values are model-specific outputs rather than definitive evidence of clinical suitability [38]. The absorption component describes the potential movement of compounds across biological membranes and into systemic circulation; it is relevant to considering different administration routes but does not establish the route by which a compound would ultimately be administered.
For predicted intestinal permeability, the Caco-2 values were \(-4.643\) for CDD and \(-5.278\) for TAN. The table classifies the former as green and the latter as red, indicating a more favourable predicted permeability category for CDD according to the software output. The Madin–Darby canine kidney (MDCK) permeability estimates were \(6.4\times10^{-5}\) for CDD and 0.00011 for TAN, and both were categorised as green. The P-glycoprotein-inhibitor indicator was similarly labelled green for both compounds, although the original output represented its predictions using qualitative symbols rather than numeric probabilities. Human intestinal absorption was marked as more favourable for CDD and less favourable for TAN. These categorical assignments provide a basis for relative comparison, but the exact classification thresholds and the interpretation of positive and negative signs should be established from the prediction platform’s documentation before clinical inferences are made. The combined absorption results suggest differences between the two compounds that could be relevant to subsequent experimental permeability assessment.
Distribution was considered using predicted plasma protein binding (PPB), volume of distribution (VD) and blood–brain barrier (BBB) penetration. The PPB estimates were 20.219% for CDD and 19.404% for TAN, suggesting relatively low predicted binding to plasma proteins for both compounds. Such estimates may affect the fraction available for distribution, although they are insufficient on their own to establish the concentration of unbound drug in vivo. The reported VD values were 1.241 and 1.073, respectively, and both were assigned a green classification in Table 8. These estimates fall within the stated comparison interval of 0.04–20 L/kg, although the units and original modelling thresholds should be confirmed. BBB penetration was indicated by a stronger positive category for CDD and a weaker positive category for TAN. This distinction may indicate differing potentials for central nervous system exposure but should not be treated as a measured brain concentration, an observed adverse effect, or evidence of desired neurological action.
| CDD | TAN | |||
| Smiles:O=C1O[C@H](C2OCCO2)[C@H]3[C@H]1C=CC3 | Smiles:N#C[C@@H]([C@H]([C@@H](COC(C)=O)OC(C)=O)OC(C)=O)OC(C)=O | |||
| Parameters | RESULT | Colors | RESULT | Colors |
| Absorption | ||||
| Caco-2 Permeability | -4.643 | Green | -5.278 | Red |
| MDCK Permeability | 6.4e-05 | Green | 0.00011 | Green |
| Pgp-inhibitor | — | Green | – | Green |
| HIA | — | Green | +++ | Red |
| Distribution | ||||
| PPB | 20.219% | Green | 19.404% | Green |
| VD | 1.241 | Green | 1.073 | Green |
| BBB Penetration | +++ | Red | + | Yellow |
| Metabolism | ||||
| CYP1A2 inhibitor | — | – | ||
| CYP2C19 inhibitor | — | — | ||
| CYP2C9 inhibitor | — | — | ||
| CYP2D6 inhibitor | — | +++ | ||
| CYP3A4 inhibitor | – | — | ||
| Excretion | ||||
| T\(_{1/2}\) | 0.811 | 0.955 | ||
| CL | 7.410 | Green | 2.480 | Red |
| toxicity | Probability | Prediction | Probability | Prediction |
| Hepatotoxicity | 0.69 | Active | 0.69 | Active |
| Carcinogenicity | 0.62 | Inactive | 0.62 | Inactive |
| Immunogenicity | 0.96 | Active | 0.96 | Active |
| Mutagenicity | 0.97 | Inactive | 0.97 | Inactive |
| Cytotoxicity | 0.93 | Inactive | 0.93 | Inactive |
| Physicochemical Properties | ||||
| Formula | C10H12O4 | C13H17NO8 | ||
| Molecular weight | 196.20 g/mol | 315.28 g/mol | ||
| Num of heavy atoms | 14 | 22 | ||
| Num. of H-bond donors | 0 | 0 | ||
| Num. of H-bond acceptors | 4 | 9 | ||
| TPSA | 44.76 Å\(^2\) | 128.99 Å\(^2\) | ||
| Drug-likeness | ||||
| Lipinski | YES, 0 violations | Yes, no violations | ||
| Ghose | Yes | Yes | ||
The predicted metabolic properties were examined through cytochrome P450 enzyme-inhibition indicators, including CYP1A2, CYP2C19, CYP2C9, CYP2D6 and CYP3A4. The tabulated symbols suggested low predicted inhibitory potential for CDD across the listed enzymes, whereas TAN was assigned a stronger positive CYP2D6-inhibition category. This finding merits consideration because CYP2D6 participates in the metabolism of several medicines and clinically important interactions can occur when metabolic pathways are inhibited. Nevertheless, the strength of such an effect cannot be quantified from the qualitative category alone; enzyme-inhibition assays and concentration-dependent data would be needed to investigate this predicted liability. Excretion-related behaviour was summarised using estimated elimination half-life (\(T_{1/2}\)) and clearance (CL) [53]. The reported half-life values were 0.811 for CDD and 0.955 for TAN, whereas predicted clearance values were 7.410 and 2.480, respectively. Within the adopted model, these values suggest relatively faster elimination of CDD and potentially slower elimination of TAN, but the units, population assumptions and clinical significance of these parameters remain to be established.
Toxicity prediction identified an active hepatotoxicity classification for both compounds, with a probability score of 0.69, equivalent to 69%. An active immunogenicity classification was also reported for both, with a probability score of 0.96, equivalent to 96%. These values describe algorithmic predictions of the stated endpoints, rather than experimentally demonstrated hepatotoxicity or immunogenicity. Conversely, the models classified carcinogenicity, mutagenicity and cytotoxicity as inactive, with reported probability scores of 0.62, 0.97 and 0.93, respectively. Inactive computational classifications cannot establish that a compound is safe, nonmutagenic or noncytotoxic. The apparent combination of favourable predictions for some endpoints and flagged liabilities for others therefore calls for confirmatory toxicological testing using appropriately selected assays and exposure conditions.
Regarding physicochemical characteristics, the table reports a molecular formula of C\(_{10}\)H\(_{12}\)O\(_4\) and a molecular weight of 196.20 g/mol for CDD, together with C\(_{13}\)H\(_{17}\)NO\(_8\) and 315.28 g/mol for TAN. Their calculated topological polar surface areas were 44.76 and 128.99 Å\(^2\), respectively, indicating a marked difference in predicted polarity-related characteristics. Both compounds were classified as satisfying Lipinski’s rule of five without violations and as passing the Ghose filter [54]. These commonly used drug-likeness filters describe general physicochemical ranges rather than providing direct evidence of therapeutic benefit. On balance, the computed absorption, distribution and elimination descriptors appear comparatively favourable for CDD, whereas TAN is associated with a stronger CYP2D6-inhibition flag and less favourable intestinal absorption classifications. At the same time, the predicted hepatotoxicity, immunogenicity and BBB-related findings highlight the need for caution. The results support further targeted investigation of both molecules, with particular emphasis on experimental bioavailability, enzyme interactions, adverse effects and target-specific activity.
This study employed a combination of quantum-chemical calculations, molecular docking and computational ADMET prediction to examine \(^1\)H-cyclopenta[c]furan-3(3aH)-one, 6,6a- dihydro-1-(1,3- dioxolan-2-yl)-, (3aR,1-trans,6a-cis) (CDD) and tetraacetyl-D-xylonic nitrile (TAN) as molecules for further investigation in diabetes-related research. Geometry optimisation at the \(\omega\)B97XD/6-311++G(2d,2p) level produced calculated molecular structures with distinct bond parameters. Frontier molecular orbital analysis yielded HOMO–LUMO gaps of 4.45 eV for CDD and 6.02 eV for TAN, indicating comparatively greater electronic softness for CDD within the adopted theoretical model. Molecular electrostatic potential and natural population analyses further described the different charge distributions and potentially reactive sites of the two compounds. Non-covalent interaction plots revealed areas of weak attractive interactions and steric repulsion, with relatively prominent van der Waals regions for TAN.
The reported calculated NMR chemical shifts were considered in relation to the proposed molecular structures, including carbonyl, oxygen-containing ring and acetal-associated signals for CDD and pentose-related, ester carbonyl and nitrile-associated signals for TAN. The infrared comparison data also identified selected stretching modes, although several assignments and tabulated comparison values require confirmation against the original calculation outputs and spectral sources. Molecular docking against the selected structures produced predicted scores ranging from \(-4.4\) to \(-7.5\) kcal/mol for CDD and TAN, with the most favourable studied-compound score associated with CDD docked against 5EE7. Dasatinib, included as a computational comparator rather than an established antidiabetic medicine, produced more negative scores across the target set. The reported residue contacts offer possible explanations for individual docking poses, but these scores and contacts cannot by themselves establish measured binding affinity, functional target inhibition, or biological efficacy.
Predicted ADMET properties suggested comparatively more favourable intestinal permeability and elimination behaviour for CDD, whereas TAN showed less favourable absorption-related classifications and a potential CYP2D6-inhibition liability. Both compounds were classified as meeting Lipinski’s rule of five and the Ghose filter, but the reported hepatotoxicity and immunogenicity predictions indicate that further safety assessment is essential. In addition, the selected protein structures differ in their direct relevance to glucose metabolism, making a clear target-specific pharmacological rationale particularly important. Accordingly, the present computational results should be treated as exploratory evidence for candidate prioritisation, not as proof of antidiabetic action. Future research should verify the chemical structures and spectral assignments, document reproducible receptor preparation and docking parameters, validate the predicted ligand–protein interactions, and undertake appropriate biochemical, cellular, pharmacokinetic and toxicological investigations. Such steps are necessary to determine whether the electronic and docking properties observed here translate into meaningful biological activity or potential therapeutic relevance in diabetes mellitus.
Author Contributions: Eban L. Kechi: Conceptualization and Supervision. Peggy Willie: Project Administration and Methodology. Promise Inegbedion: Writing and Editing. Jonathan O. Enyike: Data Curation and Validation. Maria A. Unimuke, Opeyemi M. Oyebanji: Writing, Editing and Proofreading. Blessing Gregory Eworo: Formal analysis and Visualization. Kayode A. Osuwa: Resources and Validation.
Conflicts of Interest: All authors confirm that no financial or personal conflict of interest could have impacted the research work or findings presented in this research paper.
Data Availability: The values reported in the study are presented in the manuscript. Supporting raw calculation files, molecular-docking outputs, and spectral source data were not included in the material supplied for editorial review.
Funding Information: This research received no financial support from governmental or non-governmental agencies.