
Africa is the store house of about 70% of the world’s resources out of which 80% residents in rural areas. But despite this enviable position, the continent merely controls five percent of the enormous resources. Smarter outsiders are the ones reaping the benefits of African people especially the rural dwellers bedevilled by bad politics or poor governance of the belly and unbridled bitterness.
Water is the most basic natural resource. More than 97% of the earth’s water is saline ocean water. Another largely unavailable reservoir of water is the 2% of the earth’s water frozen in polar ice caps and glaciers. Of the remaining 1% of’ the earth’s water, more than half (0.6% of the total supply) is contained in groundwater [1]. Water is one of the most common substances known, being a good solvent for many materials but rarely exists in its pure form in nature. Natural sources of water include rain, spring, well, river, lake and sea. Rain water is the purest form of natural water because it is formed as a result of the condensation of water vapor in the atmosphere and can be classified as a natural form of distilled water. The water from the other sources especially river, lake and sea, contains a lot of impurities which include dissolved gases, mineral salts, bacteria and organic remains [2].
The United Nations as part of its Millennium Development Goals (MDGs) stipulates the proportion of the population without sustainable access to safe drinking water be reduced by half by 2015. As a result, the developed nations had 91% to 100% increase in drinking water coverage and the lowest level of coverage was in sub-Saharan Africa, South Asia and East Asia from less than 50% to 75% coverage [3].
In Nigeria, there are signs of major water crises that are getting worse and will continue to deteriorate if not checked by corrective action. The continuously intensifying scarcity of water resources is a crucial problem [4]. The primary reason for the water scarcity being experienced in Nigeria could be traced to growing disparity between the decreasing effective supply and increasing demand for water. The causes of this obvious imbalance between urban demand and water supply manifests in the continuous inability of supply quantities to meet demand. This could be traced to the population growth, higher living standards, increased irrigation, urbanization coupled with the impacts of climate change [5]. Nigeria still lacks the human and financial resources to provide adequate water and sanitation infrastructure and services for the total populace. Surveys carried out in major parts of Nigeria, showed obvious gaps and challenges in meeting the Millennium Development Goals (MDG) for water supplies and services [6]. Rapid population growth has not been accompanied by an increase in the delivery of essential urban services such as water supply, sewerage and sanitation, and collection and disposal of solid wastes. It is estimated that currently only about 50% of the urban and 20% of the semi- urban population have access to reliable water supply of acceptable quality (i.e. something better than a traditional source). Overall effective urban water supply coverage may be as low as 30% of the total population due to poor maintenance and unreliability of supplies. Rural coverage is estimated at 35% [7].
It is currently estimated that about 65% of the rural population do not have access to safe and reliable water supply and adequate sanitation facilities. Access to inadequate water supply and means of safe disposal of excreta, could lead to a significant effect on health from bacteria diseases and virus infections, loss of educational participation and attainment, affect economic productivity, and dignity in rural areas [8].
The study location is presented in Figure 1. There is a maze of numerous rivers, and lakes in and around Olorunda and Egbedore local government areas with very prominent rivers like Apala and Osun River. The study area enjoys luxuriant vegetation with high forest zone. The evident all year round green tree vegetation is an indication of availability of adequate soil moisture that provide underground water to the trees and other vegetation types in the dry season. On the other hand, the observed vegetation pattern signifies enhanced groundwater infiltration potential across the study area with the exception of rock outcrops and heavily populated urban areas.

The interview conducted with individuals during preliminary survey confirmed the level of water scarcity. There were few wells, some with pumps to serve individual houses and others were drawn with rubber pails and buckets. No stream or river flows through the community but there is a pond where they fetch water (Figure 2). There are also hand pump boreholes. This results in waste of productive hours. This made the community to settle for the use of naturally impounded untreated surface water with low quality which is about 600m distance from the centre of the village (Figure 2). This water source is however not reliable because it does not meet the demand of the community during dry season.

Table 1 gives the water supply situation in the community. Columns 1 give the 2006 Population figure as provided by the National Population Commission NPC. The third column is the water demand of 40 lpcd. The sum of these gives the values shown in column 3 of Table 1. Column 4 and 5 are output from field survey.
| 1 | 2 | 3 | 4 | 5 | ||||||||
|---|---|---|---|---|---|---|---|---|---|---|---|---|
| Pop. | Estimated water | Source of Water Supply in Number | Capacities | |||||||||
| demand l/d | Motorized | Hand Pump Borehole | River | RWH | 1/d | |||||||
| Borehole | Others | Total Installed | Currents Outputs | |||||||||
| OP NOP | OP | NOP | OP | NOP | OP | NOP | OP | NOP | ||||
| 4508 | 180320 | 01 | 1 | 4 | 1 | 4 | 1 | 182500 | 28000 | |||
Surface source of water under column 4 is in terms of location only. The installed capacities in column 5 were obtained from the number of existing facilities. Motorized boreholes were assumed to produce 100,000 l/d, hand pump 13,000 l/d and the installed capacities, current production and distribution patterns of the surface schemes were obtained from the promoters and verified by site visits. Column 5 is thus a product of all installed facilities as against the current output. The Table shows that if all the facilities are working at full installed capacity, there will be no shortfall. At the current production of 28,000 l/d, the shortfall is up to 152,320 l/d. In simple terms 15.53% of the water required is available even with the installed facilities.
Table 2 presents the summary of water supply promoters and the type of facility they promote. A summary of the current status of these facilities is also indicated in the table. It shows that 3 of the boreholes are currently not operational; this is due in part to the attitudes of the community and non integrative approach of providing infrastructure for the populace. Other facilities as indicated in the table refer to protected hand dug wells. Table 3 gives a comparative involvement of the promoters in the community. There is a difference between the number of facilities operated by a promoter and the quantity of water produced and subsequently the impact on the citizenry. The percentage of facilities promoted by the various agencies is presented both in terms of the total number of facilities and the total quantity of water provided. This is to ensure that a wrong impression is not given concerning the direct effect of the agencies on the study area. The Table shows that while the Local Government is responsible for about 41.67% of the facilities in the Study area, it is responsible for 46% of the available safe water supply. Other promoters are the politicians, Donors (8.3%) and community 8.33% and others 41.67%. Figures 3 and Figure 4 are from result of Table 2 showing water supply by different levels of promoters.
| Promoter | Motorized BH | Hand Pump BH | Surface Schemes | Others | Total | ||||
|---|---|---|---|---|---|---|---|---|---|
| OP* | NOP** | OP | NOP | OP | NOP | OP | NOP | ||
| COMMUNITY | 0 | 0 | 0 | 0 | 1 | 4 | 1 | 6 | |
| DONOR | 0 | 0 | 0 | 1 | 1 | ||||
| FGN | 0 | 0 | 0 | 0 | 0 | ||||
| JOINT | 0 | 0 | 0 | 0 | 0 | ||||
| LGA | 0 | 0 | 1 | 4 | 5 | ||||
| STATE | 0 | 0 | 0 | 0 | 0 | 0 | |||
| Total | 0 | 1 | 1 | 4 | 1 | 0 | 4 | 1 | 12 |
\(^{*}\)OP Operational, \(^{**}\)NOP, Not Operational, MBH \(=\) Motorised Borehole, HBH \(=\) Hand pump Borehole, Others (Protected hand-dug wells mostly)
| S/No | Item | % water Supply Facilities Promoted | |
|---|---|---|---|
| % By Number | % By Quantity | ||
| 1 | Facilities by Federal Government | 0 | 0 |
| 2 | Facilities by State Government | 0 | 0 |
| 3 | Facilities by Local Governments | 41.67 | 83.3 |
| 4 | Facilities by Communities | 8.33 | 2.7 |
| 5 | Facilities by Donors | 8.33 | 7.2 |
| 6 | Facilities by Others | 41.67 | 6.8 |
| Total | 100 | 100 | |

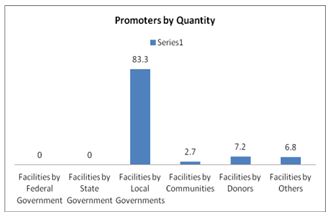
Table 4 gives the water supply services demand and supply in the community. The first two columns are from Table 1. Column 3 gives the theoretical availability of water against demand which is defined as the total available safe water divided by total water demand. This was simply calculated by dividing the current product in Table 1 with the demand in column 3. Column 4 is the area of coverage achieved by the available water. This is defined simply as the ratio of the sum of people who get their safe water from this source. Supply coverage is about 30%. Column 5 is a direct output of the household survey. This is the actual number of respondents with access to safe water. Access to safe water is generally is poor and is about 18%.
| 1 | 2 | 3 | 4 | 5 | ||
|---|---|---|---|---|---|---|
| Population | Water Demand 1/d | Theoretical % of Water Supply vs Demand | % of Water Supply Coverage | % Access to safe Water | ||
| 4508 | 180320 | 43 | 20 | 10 | ||
Table 5 gives a summary of the water supply situation in the study area. This table was prepared like Tables 4.4 and 4.5. The installed capacity is 182,500.00 l/d while the current production is 28,000.00 l/d. It shows that capacity utilization is about 15.3%. It also shows that if the facilities are working at full capacity, the water supply will be surplus over demand. Water supply coverage is poor and this is responsible for the reason why the rural people result to taking unsafe water Figure 2.
| Total LGA Population | Estimated Urban Water demand l/d | Available l/d | Theoretical % of Water Supply vs Demand | % of Water Supply Coverage |
% Access to safe Water |
|||||
|---|---|---|---|---|---|---|---|---|---|---|
| Total installed | Current Outpot | |||||||||
| 4508 | 180320 | 182500 | 28000 | 15.53 | 20 | 10 | ||||
Average time travelled to get water and return \(=\frac{Time\ \ travelled\ \ (minutes)}{No.\ \ of\ \ people}\)
\(=\frac{30+60+40+30+30+60+30+30+180+30+60+120+60+120+50+180+60+40+90+120+90+60+120+90+60+180+240+180++120+60+120+180+120}{30}\) \(=\frac{2770}{30}=\) 92 minutes \(=\) 1 hour 30 minutes.
Average distance to trek to fetch water \(=\frac{Distance \ \ travelled(m)}{No.\ \ of \ \ people }\)
\(=\frac{100+100+100+280+500+82+300+80+250+200+180+80+240+240+500+150+100+120+60+60+180+5+250+230+100+120+5+10+250}{30}\)
\(=\frac{4870}{30}=160m\).It takes an average of one hour and thirty minutes for the community people to get water and return to their houses and an average of 162m to trek to fetch water. This shows that many of the people in the community go through stress in order to have water for use.
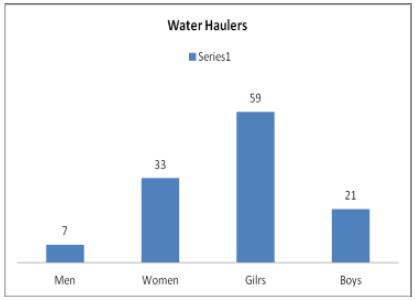
Figure 5 shows haulers with adult male, adult women, male children and female children being 6%, 27%, 18% and 49% respectively. The adult women and female children mostly go to the source to fetch water for the household. This accounts for the poor performance of rural ladies in Senior Secondary School certificate Examination (Figure 6 and 7).


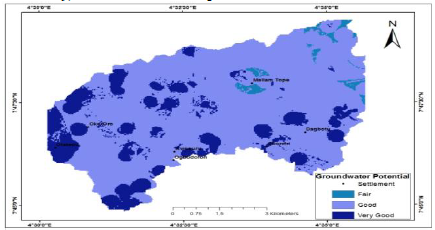
The result of the groundwater potential zones for the study area is shown in Figure 8. The groundwater potential map is generated through the reclassified, weighted and overlaid of some factors (maps) such as; lineament density, hydraulic conductivity, land use, rainfall intensity, soil texture (sand, clay and silt) and permeability using geographic information system techniques. The groundwater recharge potential zone is categorized into three classes from fair to very high. From the final map, the locations with very good covers 18% o, good covers 80% and fair covers 2% of the study area. The areas with very good and good groundwater recharge potential zones fall on the locations such as Ofatedo, Gbonmi, Oke oro, Awosuru, Gbodofon, and Dagbolu in the study area.
Survey shows that approximately 2.1% of respondent households have access to improved sanitation facilities and inversely, 97.9% uses unimproved sanitation facilities in the area. The proportions of households using the various forms of improved sanitation facilities in the State are given in Table 6. The table indicates that simple pit latrines (covered) are the most prominent sanitation facilities in most of the area.
| Sampled population | Latrine | Water closet | Hand wash | Septic system | Public server | Sullage disposal | Storm water | Total facilities |
|---|---|---|---|---|---|---|---|---|
| 350 | 1.2 | 0.9 | 0.0 | 0.0 | 0.0 | 0.0 | 0.0 | 2.1 |
There are no promoters from the State, Local governments, as well as Communities nor donor agencies. The Abandoned Latrine in a church is shown in Figure 9.

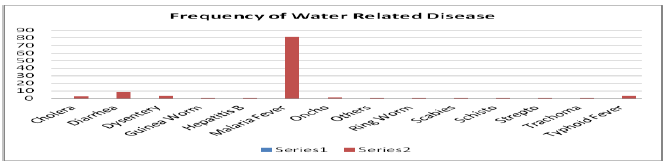
The result of the household survey shows that the most common water-related diseases in area are malaria, diarrhoea, typhoid fever, dysentery, and cholera. Their frequencies are 81.2 %, 8.41 %, 3.40 %, 3.22 %, and 2.76 % respectively (Table 7 and Figure 10). The least common water-related diseases in the area are streptococci, trachoma, Guinea worm, schistosomiasis, and Ring worm. Their frequencies are (0.02%), (0.04%), 0.11%), (0.32%), and (0.39%) respectively. Malaria in particular has been associated with the tropics where weather conditions are favorable to mosquitoes.
| Cholera | Diarrhea | Dysentery | G. Worm | Hepatitis B | Malaria Fever | Oncho cerciasis |
|---|---|---|---|---|---|---|
| 134 | 409 | 157 | 5 | 29 | 3946 | 66 |
| Others | R. Worm | Scabies | Schisto somiasis | Strepto cocci | Trachoma | Typhoid Fever |
| 26 | 19 | 21 | 15 | 1 | 2 | 164 |
Each value was computed as the proportion of households where any member suffered the water-related disease in 2019. *Note that a respondent may pick more than one disease.
Table 8 reveals that access to adequate supply of water would help in reducing the expenditure of time and energy spent in fetching water, increase water consumption, reduce time spent in queuing or seeking alternative sources and water-borne diseases. The economic loss due to water related diseases in a small popupaltiion of 4,508 is \(\aleph\) 29,964,000 per annum, but productive fore has been said to be 30 %, then the loss in the community is \(\aleph\) 8,989,200. If we have to extrapolate to the current Nigeria population of 208,000,000:00, the yearly loss for the unproductive downtime due to water related disease is N 414,763,442,768:00 excluding cost of treatment. This shows that insufficient water supply in rural areas amount to double loss. The patients are not working and are spending.
| Population | Total incidence of diseases | Total Productive days for the population | Down unproductive days1* | Population Expected Income2* | Down unproductive days ost3* |
|---|---|---|---|---|---|
| 4508 | 4994 | 64152 | 19976 | 96,228,000 | 29,964,000 |