
PM\(_{2.5}\) refers to fine particulate matter in the atmosphere, characterized by an aerodynamic equivalent diameter of 2.5 µm or less. As they are extremely small and light, PM\(_{2.5}\) particles can persist in the atmosphere for extended periods and can be transported over long distances by atmospheric circulation, resulting in widespread air pollution [1]. Additionally, PM\(_{2.5}\) can cause reduced visibility and lead to hazy weather in urban areas [1]. Furthermore, PM\(_{2.5}\) plays a significant role in the global climate by influencing cloud formation and rainfall processes, thereby indirectly contributing to climate change. Moreover, this fine particulate matter is also able to enter the human alveolar, posing a great threat to human health, and is therefore also known as lung-borne particulate matter [2, 3]. Consequently, PM\(_{2.5}\) has emerged as one of the prominent air pollutants causing widespread concern.
Variations in PM\(_{2.5}\) mass concentration are related to other air pollutants, local meteorological factors and industrial emissions [4– 6]. Many city-scale studies have been conducted to investigate the relationship between PM\(_{2.5}\) and its influencing factors and predict its mass concentration changes using different models. Certain researchers have used VAR model to analyze the dynamic relationship between PM\(_{2.5}\) and various air pollutants and meteorological factors, and found that various air pollutants and meteorological factors have different degrees of influence on PM\(_{2.5}\) in various periods [7]. In addition, scholars have used multi-scale geographically weighted regression (MGWR) model to study the influence of local spatial and temporal effects on PM\(_{2.5}\) in China [8]. Moreover, building upon these studies, other scholars have obtained a regression formula for PM\(_{2.5}\) concentration [9]. It has been shown that the components and sources of PM\(_{2.5}\) are complex, and the influence of meteorological factors also includes complex physicochemical processes. Consequently, it is necessary to consider the intricate non-linear relationship between PM\(_{2.5}\) mass concentration and the influencing factors [10]. However, current studies on the influencing factors of PM\(_{2.5}\) at urban scale generally only consider the linear relationship between PM\(_{2.5}\) and the influencing factors, often ignoring the complex non-linear relationships between different variables. The generalized additive model (GAM), a statistical model often applied in environmental studies, is a semi-parametric extension of the generalized linear model (GLM). Compared with other models, the GAM can directly deal with the complex non-linear relationships between the response variables and multiple explanatory variables, and is therefore well suited to explain the non-linear relationships between PM\(_{2.5}\) and its influencing factors, and further based on the model results to prediction of PM\(_{2.5}\) concentrations [11, 12].
Among the influencing factors of PM\(_{2.5}\), industrial emissions are one of the important factors causing PM\(_{2.5}\) pollution [4], and electricity consumption data can reflect the production implementation of enterprises, which also contains the enterprise PM\(_{2.5}\) emission status [13– 15]. Currently, electricity big data is extensively utilized across numerous domains, including electricity production, operational management, quality service, and smart cities [16– 18], but there are few studies to apply electricity data to pollution analysis. Using the historical electricity consumption data of key PM\(_{2.5}\) emitting enterprises can well reflect the PM\(_{2.5}\) emission status of industrial sources. Combining the high temporal resolution industry electricity consumption data into the pollution analysis of PM\(_{2.5}\) can provide a new perspective for us to study the influencing factors of PM\(_{2.5}\).
This study aims to investigate the primary influencing factors of atmospheric PM\(_{2.5}\) particulate matter in Hefei city from 2020 to 2021 by focusing on the electricity consumption data from major PM\(_{2.5}\) emitting industries, as well as meteorological factors (temperature, wind speed, wind direction, relative humidity) and mass concentrations of atmospheric pollutants (NO\(_{2}\), SO\(_{2}\), O\(_{3}\), CO). The investigation will be conducted using the generalized additive model (GAM). Additionally, the study aims to examine the potential pathways for controlling particulate matter pollution by utilizing the GAM model constructed with electricity big data.
Hefei, the capital of Anhui Province in China, is located in the mid-latitude zone, with four distinct seasons, a mild climate and moderate rainfall. The topography is complex and varied, with three types of land forms: plains, mountains and hills.
The data on atmospheric pollutant concentrations in Hefei from 1 January 2020 to 19 May 2021 analyzed in this study were obtained from the Ministry of Ecology and Environment (http://sthjt.ah.gov.cn/site/tpl/5371, whose data are published by the Anhui Ecological and Environmental Monitoring Centre) and include PM\(_{2.5}\) (\(\mu g/m^3\)), NO\(_{2}\) (\(\mu g/m^3\)), SO\(_{2}\) (\(\mu g/m^3\)), CO (mg/m\(^3\)) and O\(_{3}\) (\(\mu g/m^3\)) near ground mass concentration data at hourly resolution.
Hourly meteorological data for the same period corresponding to the above air pollutant data were obtained from the National Oceanic and Atmospheric Administration website (http://www.cdc.noaa.gov, hereafter referred to as the NOAA website) and include temperature (T) (\(\mathrm{^\circ}\)C), relative humidity (RH) (%), Wind speed (WS) (m/s) and wind direction (WD) (\(\mathrm{^\circ}\)).
The list of major PM\(_{2.5}\) emitting enterprises in Hefei and their hourly electricity consumption data (Kw-h) for the same period corresponding to the above air pollutant data were provided by the State Grid Anhui Electric Power Company, which classified the above major PM\(_{2.5}\) emitting enterprises into nine categories of industries, and their classification and abbreviations are shown in Table 1. All electricity consumption data were subject to strict quality control to ensure completeness and representativeness, resulting in 94,059 valid data.
| List of major emitters in Hefei | Abbreviations |
|---|---|
| Iron making | ELE1 |
| Steel making | ELE2 |
| Rare earth metal smelting | ELE3 |
| Oil, coal and other fuel processing industries | ELE4 |
| Non-metallic mineral products industry | ELE5 |
| Chemical raw material and chemical product manufacturing | ELE6 |
| Textile industry | ELE7 |
| Rubber and plastic products industry | ELE8 |
| Metal products industry | ELE9 |
A generalized additive model (GAM) is a non-linear regression
framework and a semi-parametric extension of the generalized linear
model (GLM) that can capture complex non-linear relationships between a
response and multiple explanatory variables. We fitted the models using
the mgcv package in R [12, 19, 20]. The basic form is \[g(\mu) \;=\; \alpha \;+\; \sum_{i=1}^{n}
f_i(x_i), \tag{1}\] where \(\mu\)
denotes the expected value of the response variable (PM\(_{2.5}\) concentration), \(x_i\) (\(i=1,2,\dots,n\)) are the predictors, and
\(f_i(\cdot)\) are the corresponding
smoothing functions. Model adequacy was assessed using the Akaike
Information Criterion (AIC) and \(R^{2}\) [21]. We used the F-statistic, associated \(p\)-value, and adjusted \(R^{2}\) reported by the GAM to determine
the significance of each explanatory variable’s effect on PM\(_{2.5}\) and the overall goodness of fit:
larger F-statistics indicate greater relative importance; smaller \(p\)-values indicate more statistically
significant effects; and adjusted \(R^{2}\) ranges from 0 to 1, with values
closer to 1 indicating a better fit and higher explained variance [12, 22]. All figures were produced
with OriginPro 2022.
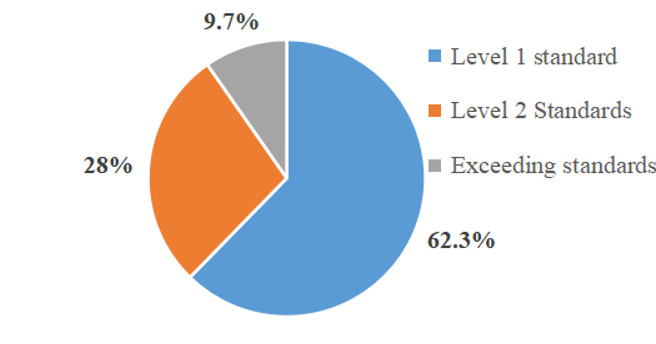
The annual average PM\(_{2.5}\) mass concentration in Hefei from 2020 to 2021 is 34.28 \(\mu g/m^3\), which complies with China’s secondary ambient air quality standard (\(\mathrm{<}\)35 \(\mu g/m^3\)) [23]. However, it still falls below the recently updated WHO 2021 standard (5 \(\mu g/m^3\)) [24]. Figure 1 illustrates that in 2020, the average daily mass concentration of PM\(_{2.5}\) exceeded the Chinese standard for 9.7% of the year. Compared with the analytical data of PM\(_{2.5}\) in Hefei in previous years [25], the annual average PM\(_{2.5}\) mass concentration decreased from 61.60 \(\mu g/m^3\) in 2015 to 34.28 \(\mu g/m^3\) in 2020, and the PM\(_{2.5}\) daily average mass concentration exceedance rate decreased to 9.7%. This signifies an improvement. Nevertheless, it still surpasses 18.2% when compared to China’s national average annual PM\(_{2.5}\) mass concentration in 2020 (29 \(\mu g/m^3\)) [23]. Furthermore, when juxtaposed with cities known for their superior air quality like Zhangjiakou [23], Hefei’s PM\(_{2.5}\) pollution remains comparatively more severe.
As shown in Figure 2, the monthly average PM\(_{2.5}\) mass concentrations in Hefei exceeded China’s national ambient air quality secondary standards for a total of three months (January, November and December) in 2020, an improvement compared to previous years [25]. The monthly mean PM\(_{2.5\ }\)mass concentrations in Hefei City exhibit a consistent pattern of decrease followed by increase throughout the year, indicating higher levels during winter and lower levels during summer. December 2020 recorded the highest monthly mean PM\(_{2.5}\) mass concentration of 74.15 \(\mu g/m^3\), while the lowest values were observed in June and August, which are summer months. The average winter PM\(_{2.5}\) mass concentration in Hefei in 2020 is 65.6% higher than the annual level, signifying a more severe atmospheric PM\(_{2.5}\) pollution during winter.

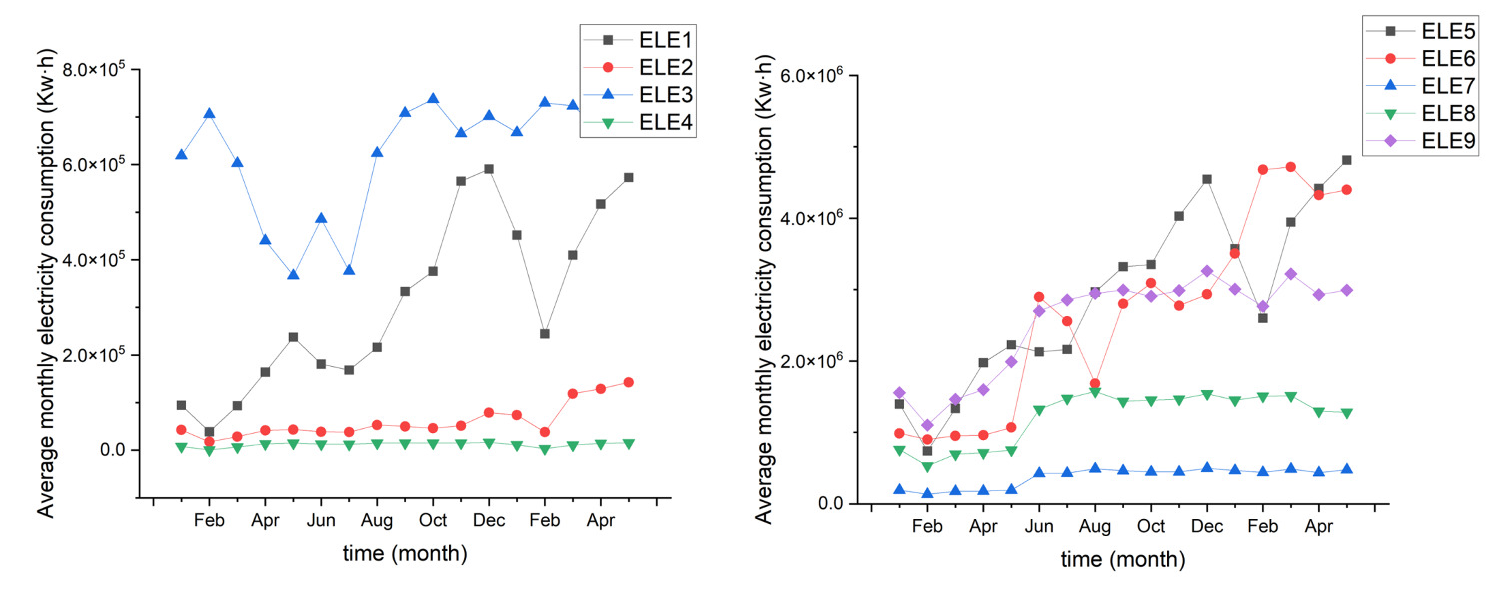
According to Figure 3, the electricity consumption of most industries (excluding the ELE4 industry) from 2020 to 2021 showed an upward trend. Specifically, ELE1, ELE3, and ELE5 industries experienced a significant increase in electricity consumption during the autumn and winter seasons, suggesting a recent rise in industrial electricity consumption in Hefei. This trend is further supported by the data in Table 2. The ELE5 and ELE6 industries exhibited the highest average daily electricity consumption during 2020-2021, reaching 2.91\(\mathrm{\times}\)10\(^{6}\) Kw-h and 2.66\(\mathrm{\times}\)10\(^{6}\) Kw-h respectively. Conversely, the ELE2 and ELE4 industries had the lowest average daily electricity consumption compared to other industries from 2020 to 2021, at 6.07\(\mathrm{\times}\)10\(^{4}\) Kw-h and 1.18\(\mathrm{\times}\)10\(^{4}\) Kw-h respectively.
| List of major emitters in Hefei | Growth rate |
|---|---|
| ELE1 | 249% |
| ELE2 | 189% |
| ELE3 | 28% |
| ELE4 | 25% |
| ELE5 | 152% |
| ELE6 | 344% |
| ELE7 | 164% |
| ELE8 | 104% |
| ELE9 | 93% |
The initial selection of temperature (T) as the explanatory variable for PM\(_{2.5}\) was fitted with the GAM model, and then variables were gradually added to the model, of which all passed the significance test (p\(\mathrm{<}\)0.001) except WS (p=0.279), which failed the significance test and was excluded.
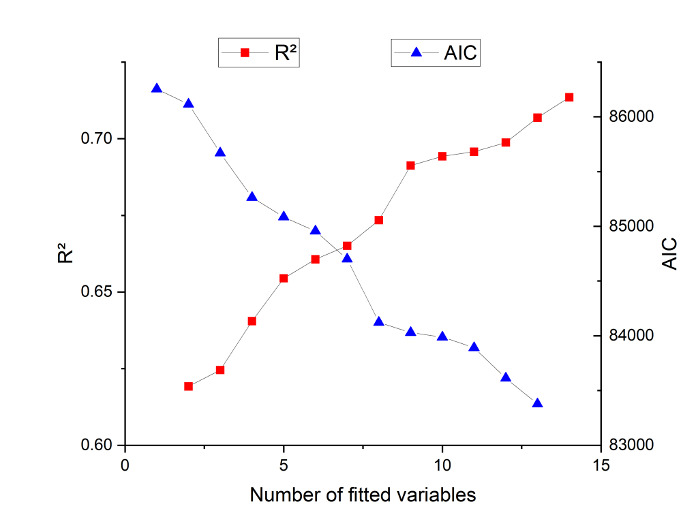
The AIC and R\(^{2}\) values for each variable added were plotted (Figure 4), which showed that as the number of variables increased the AIC value decreased and the R\(^{2}\) value increased, indicating that all the variables added were valid [26], with the addition of the rubber and plastic products and metal products variables not meeting the decreasing AIC and increasing R\(^{2}\) values and being excluded. The final model equation is g(PM\(_{2.5}\)) = s(CO) + s(T) + s(NO\(_{2}\)) + s(SO\(_{2}\)) + s(ELE2) + s(ELE1) + s(ELE3) + s(ELE4) + s(ELE5) + s(ELE6) + s(ELE7) + s(RH) + s(WD) + s(O\(_{3}\)) +\(\varepsilon\). In general, when the adjusted R\(^{2}\) value exceeds 0.5, the GAM model is considered to explain the response variable well [27], and this model has an R\(^{2}\) value of 0.7163 (Figure 5), indicating a good model fit.

As can be seen from Table 3, the final 14 fitted variables all had a statistically significant effect on the change in PM\(_{2.5}\) mass concentration at the P\(\mathrm{<}\)0.001 level, i.e. all 14 influencing factors were statistically significant as explanatory variables for PM\(_{2.5}\) mass concentration alone.
| Fitting variables | F-values | P-values | Percentage of impact |
|---|---|---|---|
| CO | 659.88 | \(\mathrm{<}\)2e-16 *** | 69.3% |
| ELE2 | 53.37 | \(\mathrm{<}\)2e-16 *** | 5.6% |
| O\(_{3}\) | 48.034 | \(\mathrm{<}\)2e-16 *** | 5.0% |
| WD | 38.231 | \(\mathrm{<}\)2e-16 *** | 4.0% |
| ELE5 | 33.921 | \(\mathrm{<}\)2e-16 *** | 3.6% |
| ELE1 | 23.823 | \(\mathrm{<}\)2e-16 *** | 2.5% |
| NO\(_{2}\) | 19.463 | \(\mathrm{<}\)2e-16 *** | 2.0% |
| SO\(_{2}\) | 17.531 | \(\mathrm{<}\)2e-16 *** | 1.8% |
| ELE6 | 11.587 | \(\mathrm{<}\)2e-16 *** | 1.2% |
| T | 11.343 | \(\mathrm{<}\)2e-16 *** | 1.2% |
| ELE3 | 10.608 | \(\mathrm{<}\)2e-16 *** | 1.1% |
| RH | 10.324 | \(\mathrm{<}\)2e-16 *** | 1.1% |
| ELE4 | 8.383 | \(\mathrm{<}\)2e-16 *** | 0.9% |
| ELE7 | 5.918 | \(\mathrm{<}\)2e-16 *** | 0.6% |
CO (69.3% influence), O\(_{3}\) (5.0% influence), WD (4.0% influence), ELE1 – Ironmaking (2.5% influence), ELE2 – Steelmaking (5.6% influence) and ELE5 – Non-metallic Mineral Products (3.6% influence) were the five fitted variables with larger F-values in the GAM model and the model was fitted well, i.e. the effect of CO, O\(_{3}\), WD, ELE1 (Ironmaking), ELE2 (Steelmaking) and ELE5 (Non-metallic Mineral Products) individually as explanatory variables had a significant effect on the change in mass concentration. The influence of CO on the change of PM\(_{2.5}\) mass concentration is 69% in the GAM, indicating that CO is the dominant influence on the change of PM\(_{2.5}\) mass concentration in Hefei in 2020. The influence of major PM\(_{2.5}\) emitting industries on the change of PM\(_{2.5}\) mass concentration is 16% in the model, indicating that industrial emissions are also the influence on the change of PM\(_{2.5}\) mass concentration. PM\(_{2.5}\) mass concentration change is one of the important factors.
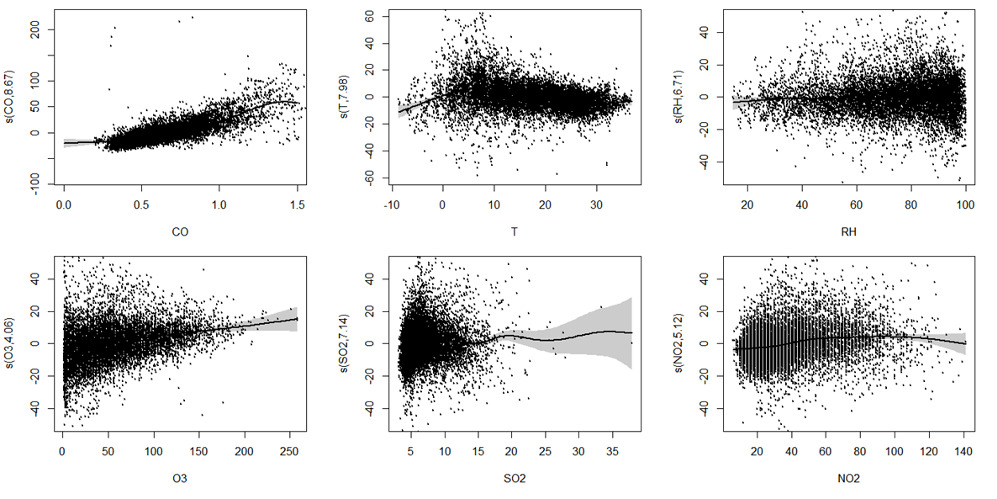
From Figure 6, the variables CO, O\(_{3}\), and PM\(_{2.5}\) display a positive correlation, suggesting that an increase in CO and O\(_{3}\) is significantly associated with an increase in PM\(_{2.5}\) mass concentration. One possible explanation for the strong correlation between PM\(_{2.5}\) and O\(_{3}\) is that O\(_{3}\), a potent oxidant, can oxidize substances in the air thereby generating aerosols and acid mists. These particles, in turn, attract more dust and heavy metal ions, ultimately leading to an increase in PM\(_{2.5}\) concentrations [28]. CO, on the other hand, is primarily emitted from fossil fuel and biomass combustion. Thus, one possible reason for the strong correlation between PM\(_{2.5}\) and CO is that the major constituents of PM\(_{2.5}\) result from primary emissions [29]. Additionally, primary pollutants like CO can undergo photochemical reactions, producing the secondary pollutant O\(_{3}\) in the lower atmosphere, which further increases PM\(_{2.5}\) concentrations [30]. Furthermore, it is observed that PM\(_{2.5}\) slightly decreases as temperature rises above zero degrees Celsius, a pattern consistent with the higher levels of PM\(_{2.5}\) during winter compared to summer. Moreover, small increases in SO\(_{2}\) and NO\(_{2}\) concentrations, as well as changes in relative humidity (RH), have minimal impact on PM\(_{2.5}\) concentrations.
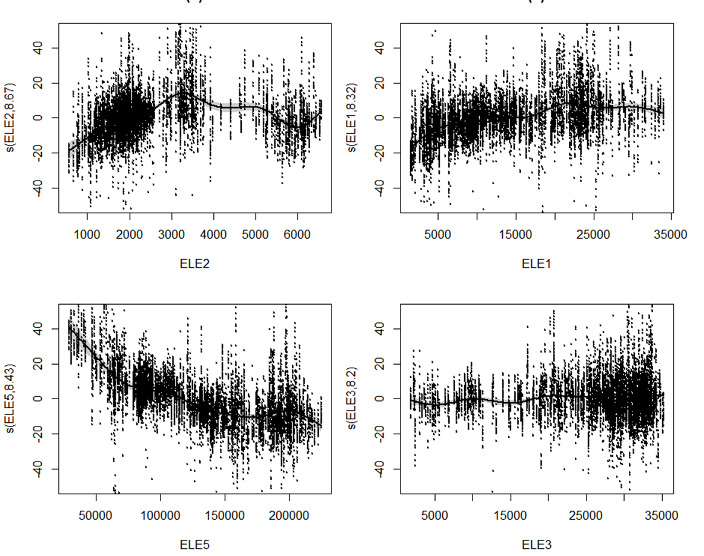
According to Figure 7, PM\(_{2.5}\) mass concentrations in iron making (ELE1) increase with electricity consumption below 18,000 Kw-h. Similarly, in steel making (ELE2), PM\(_{2.5}\) mass concentrations rise with electricity consumption below 3,000 Kw-h. These findings suggest a correlation between increased electricity consumption and higher PM\(_{2.5}\) mass concentrations in the smelting industry in Hefei. It is likely that the emission of PM\(_{2.5}\) and related precursors from these industries is closely related to their production and electricity consumption processes. Implementing limits on electricity consumption can effectively control changes in PM\(_{2.5}\) mass concentrations for these companies. Additionally, Figure 7 shows a negative correlation between the non-metallic mineral products industry (ELE5) and the change in PM\(_{2.5}\) mass concentration. On the other hand, industries like rare earth metal smelting (ELE3) have a lesser impact on the change in PM\(_{2.5}\) mass concentration. These kinds of enterprises should control their PM\(_{2.5}\) emissions according to their specific circumstances.
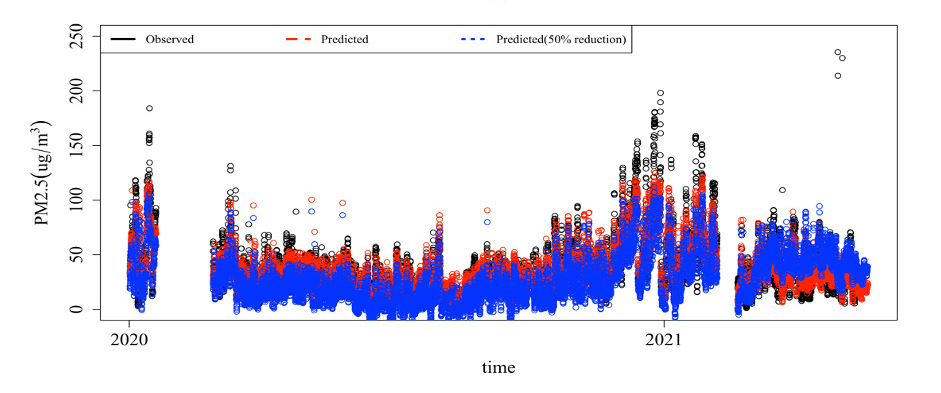
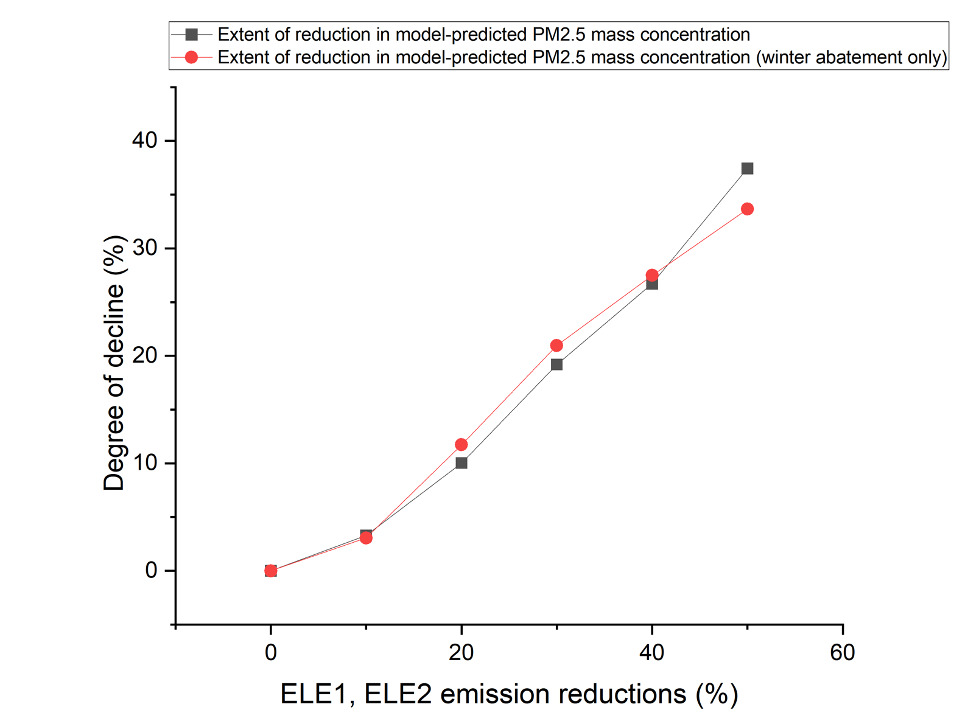
Based on the constructed GAM model, we simulated the impact of reducing the electricity consumption of the ELE1 (iron making) and ELE2 (steel making) industries by 50% on PM\(_{2.5}\). Figure 8 demonstrates that this reduction in key industries resulted in a significant decrease in PM\(_{2.5}\) mass concentration, with a 37% reduction relative to the pre-reduction levels. The mass concentration was still 23% lower compared to before. Further reductions in electricity use in the ELE1 (iron making) and ELE2 (steel making) sectors, at varying degrees, shown in Figure 9, corresponded to an increasing PM\(_{2.5}\) mass concentration reduction. For example, a 20% reduction in electricity use in the controlled ELE1 (iron making) and ELE2 (steel making) sectors resulted in a 10% reduction in PM\(_{2.5}\) mass concentration. These results highlight the potential to greatly reduce PM\(_{2.5}\) pollution by limiting electricity use in key emitting industries, as revealed by the GAM analysis.
When considering the control of electricity consumption in the ELE1 (iron making) and ELE2 (steel making) industries exclusively during the high pollution season of winter (January, February, and December), Figure 9 demonstrates that reducing electricity consumption by 20%, 30%, and 40% correspondingly led to reductions in PM\(_{2.5}\) mass concentration of 11%, 20%, and 27%. These reductions are comparable to those achieved over the entire year, signifying that limiting electricity use during high pollution seasons can yield significant results. Therefore, targeted control of high PM\(_{2.5}\) pollution seasons can effectively reduce local PM\(_{2.5}\) pollution. Based on the results of the GAM model, it is possible to implement more targeted measures for controlling PM\(_{2.5}\) pollution in each city. Implementing restrictions on the use of electricity by key local industries during high pollution seasons and in heavily polluted cities can effectively control local PM\(_{2.5}\) pollution.
The analysis of the temporal distribution characteristics of PM\(_{2.5}\) in Hefei from 2020 to 2021 reveals an improvement in PM\(_{2.5}\) pollution control in recent years. However, the average PM\(_{2.5}\)\(_{\ }\)winter mass concentration in Hefei during this period is still 65.6% higher than the annual level, indicating the persistent severity of atmospheric PM\(_{2.5}\) pollution in winter. This study utilizes a generalized additive model (GAM) to explore the main influencing factors of PM\(_{2.5}\) particulate matter concentration in Hefei from 2020 to 2021, including electricity consumption data, meteorological factors, and air pollutant concentrations from major PM\(_{2.5}\) emitting industries. Additionally, it examines potential paths for controlling particulate matter pollution.
The study reveals that CO exerts the most substantial influence on the change of PM\(_{2.5}\) mass concentration in Hefei in 2020, accounting for 69% in the GAM model. This finding highlights the dominant role of CO as an influencing factor. Furthermore, the model indicates that major PM\(_{2.5}\) emission industries contribute to a 16% change in PM\(_{2.5}\) mass concentration, emphasizing the significance of industrial emissions as a factor driving PM\(_{2.5}\) levels. Notably, smelting industries, such as iron and steel making, characterized by increased electricity consumption, are identified as having a sizable influence on the increase in PM\(_{2.5}\) mass concentration.
Based on the model fitting results, a 50% reduction in electricity consumption in the ELE1 (iron making) and ELE2 (steel making) industries leads to a notable decrease in PM\(_{2.5}\) mass concentration, with a 37% reduction after emission reduction compared to before. The reduction in PM\(_{2.5}\) mass concentration increases significantly with the degree of reduction. These findings demonstrate the substantial potential for reducing PM\(_{2.5}\) pollution by limiting the electricity consumption of key emitters according to the GAM analysis. Additionally, controlling electricity consumption in key emitting industries during the high pollution season of winter results in higher reductions in PM\(_{2.5}\)\(_{\ }\)pollution within a 40% reduction, as compared to reducing emissions in these industries throughout the year. This highlights the effectiveness of targeted control of PM\(_{2.5}\) during high pollution seasons. The GAM model’s results provide insights for implementing more targeted PM\(_{2.5}\) pollution control measures in each city. Implementing restrictions on electricity use by key local industries during high pollution seasons and in heavily polluted cities can effectively control local PM\(_{2.5}\) pollution.