
Electric vehicles (EVs) offer the potential to mitigate the environmental problems of urban logistics. Choosing EVs over fossil fuel vehicles reduces air pollution and noise levels, while significantly lowering carbon emissions [1, 2]. This transformation is particularly effective in last-mile delivery. Thanks to developing battery technologies and smart charging infrastructures, the operational constraints of EVs are diminishing, enabling the development of more sustainable and strategic solutions in urban logistics. Many variables, such as traffic density, that affect route planning in urban transportation are challenges that need to be addressed in solving dynamic routing problems of EVs.
Static delivery plans are created within the route optimization modules used in fleet management software. However, unforeseen circumstances that may arise throughout the delivery process severely limit the effectiveness of these plans [3]. In real-world logistics operations, traffic conditions are one of the most critical variables and significantly affect operations [4, 5]. Traffic congestion, particularly in urban transportation, leads to disruptions to planned routes, longer delivery times, and therefore increased operational costs. It not only extends delivery times but also directly impacts EV range anxiety and energy consumption. Congestion, in particular, can significantly increase EV battery consumption, disrupting planned charging strategies and increasing range anxiety. In this context, route optimization systems must consider not only the initial plan but also dynamic conditions. Therefore, various solution approaches have been developed in the literature for the Dynamic Vehicle Routing Problem (DVRP).
DVRP is first introduced in the work of Psaraftis [6]. Pillac et al. [7] conducted a comprehensive literature review and examined DVRP. Psaraftis [8] has thoroughly covered the last thirty years of DVRP in their work and has shown the process of transition from the vehicle routing problem (VRP) to Stochastic DVRP. Stochastic DVRP is a type of problem in which demands arise probabilistically. Rios et al. [9] detailed the application areas, solution methods, and types of DVRP with a literature review covering the last seven years. They emphasized that the literature in urban logistics is rapidly expanding. Also noted that metaheuristic algorithms are gaining prominence in solving problems and can be effective in generating real-time solutions using online data. Mardešić et al. [10] stated that classical deterministic methods are insufficient to address dynamic demands and changing traffic conditions. They evaluated the potential of methods such as Markov Decision Processes, dynamic programming, and reinforcement learning. They suggested using segmentation and generalization techniques due to computational complexity.
Studies in dynamic vehicle routing and traffic systems demonstrate the increasing importance of real-time decision-making under increasing uncertainty. Consequently, Berbeglia et al. [11] demonstrate that online algorithms, rescheduling strategies, and predictive approaches, particularly in dynamic delivery problems, increase operational flexibility and responsiveness in high-uncertainty environments such as urban logistics. On the other hand, focusing on the functioning of traffic dynamics on complex network structures, Chen et al. [12] emphasize that the performance of transportation systems depends not only on vehicle routes but also on the topological characteristics of the network and routing algorithms. Ritzinger et al. [13], highlight the role of scenario-based planning, Markov decision processes, and sampling techniques in integrating stochastic elements into vehicle routing problems, while also emphasizing implementation challenges such as data access, processing time, and real-time adaptation. Zhang and Woensel [14] examine the problem in detail and provide an extensive literature review. The study compares solution approaches and highlights the need for more agile, data-driven, and adaptive solutions for real-time decision-making. Moreover, some studies focus on multi-objective optimization models [15, 16], while others contribute to D-EVRP from different perspectives by developing approaches that integrate dimensions such as risk, uncertainty, and data learning [17, 18]. The majority of studies address the fundamental dimensions of the problem (time, energy, and demand dynamics) in an integrated manner. Solution methods range from deterministic programming to reinforcement learning, from classical heuristic algorithms to simulation-supported hybrid methods. All the studies highlight the need to consider technology, data, and algorithmic flexibility together in the field of dynamic vehicle routing.
Studies that consider traffic factors in dynamic vehicle routing studies are also emerging as an important research area. In an early study, Taniguchi and Shimamoto [19] developed a Dynamic vehicle routing and scheduling model with time windows (DVRPTW) that incorporates real-time traffic information, achieving significant reductions in total costs and vehicle operating times. Similarly, Wang et al. [20] focused on dynamic route change strategies under rapidly changing traffic conditions. To assess the potential of real-time traffic information to increase fleet management efficiency, the researchers proposed a hybrid simulation approach combining a microscopic simulation model and a route decision model. The route decision model integrates updated average link travel times from the microscopic simulation to adjust route plans based on real-time traffic conditions. The algorithm used a link-to-link shortest path algorithm with turn penalties that takes into account the complex structure of real road networks and turn restrictions. Huang et al. [21] developed an adaptive algorithm for a DVRP based on real-time traffic information. The algorithm is based on three main components: an incident management system, an Ant Colony System (ACS) algorithm, and a Dynamic Path Adaptive Search procedure. Kim et al. [22] considered a DVRP model with non-stationary stochastic travel times under traffic congestion. They formulated the problem with a Markov Decision Process (MDP) model due to sequential decision making and stochastic changes in traffic conditions.
Building on these earlier efforts, Sun et al. [23] established a dynamic vehicle routing model for a dynamic pick-up and delivery problem considering multiple dynamic events (DPDP-MDE), including new and modified requests, traffic congestion, and vehicle breakdowns. Their dynamic algorithm framework, which combines TS, ALNS, and a dynamic insertion method, effectively synchronized unfixed and new requests, improving initial solutions by up to 9.98% while maintaining low computation times. Zajkani et al. [5] proposed a distributed cooperative predictive approach for DVRP that models traffic congestion with a normal distribution, allows multiple routes between nodes, and combines capacitated clustering with binary integer programming, reporting up to an 8 % reduction in total cost compared with static VRP solutions. Sarbijan and Behnamian [24] further broadened the scope by addressing a Real-Time Feeder Vehicle Routing Problem (RTFVRP) that combines heterogeneous fleets of trucks and motorcycles to improve urban freight distribution. Modeling the problem as a mixed-integer linear program, they applied a dynamic inertia weight particle swarm optimization (DIWPSO) algorithm and showed that, across 21 DVRP test instances, particle swarm optimization achieved 34.33% cost savings (surpassing differential evolution’s 30.37%) while significantly reducing computation times in both static and dynamic settings. Building on predictive control concepts, Zhang et al. [25] introduced a Model Predictive Control (MPC)-based planner that leverages a Gaussian-process travel-time predictor and an offline graph-pruning algorithm to enable online, time-minimized routing decisions. Simulation results showed an average 16.12% travel-time reduction compared with traditional Dijkstra-based shortest paths.
In this study, a static route plan is generated by focusing on a one-day sample distribution scenario for a bottled water distribution company serving the Büyükdere neighborhood of Eskişehir. The ALNS algorithm is used to generate the static plan. The Routing Markup Language (RML) standard is created for the use of the algorithm in fleet management systems and route optimization. Routes are also represented using the developed data structure. Route data is then used for analysis, traffic, simulation, and dynamic processes in fleet management application. The obtained routes are separated into three scenarios (no traffic, off-peak hour, and peak hour) by simulating the traffic conditions that may occur in a day in the Büyükdere environment. Three scenarios, created by taking into account different traffic conditions, are run in the Simulation of Urban Mobility (SUMO) application. The results obtained from the simulation environment are analyzed, and the initial route performance and scenarios that can be encountered in the real world are interpreted. Furthermore, this study models a real-life vehicle failure and the subsequent intervention strategy within a dynamic routing context. The effectiveness of the scenario is evaluated to present a decision-support framework for fleet management operators.
The remainder of the paper is structured as follows. §2 is dedicated to material and method, first detailing the system architecture, algorithm and the Routing Markup Language (RML) in §2.1, followed by the proposed vehicle failure strategy in §2.2, and the traffic environment model in §2.3. In §3, the results obtained from our scenarios, including the outputs of the fleet management system are presented and discussed. The paper concludes with §4, which provides a summary of findings and suggests directions for future research.
Fleet management systems are vital for ensuring continuous monitoring of distribution processes under variable environmental conditions and operational uncertainty. These systems, which offer real-time monitoring, rerouting, and response mechanisms to unforeseen circumstances, play a vital role as decision support tools in urban logistics. The fleet management system used in this study and the specific data structure used for routing are detailed in the following subsections.
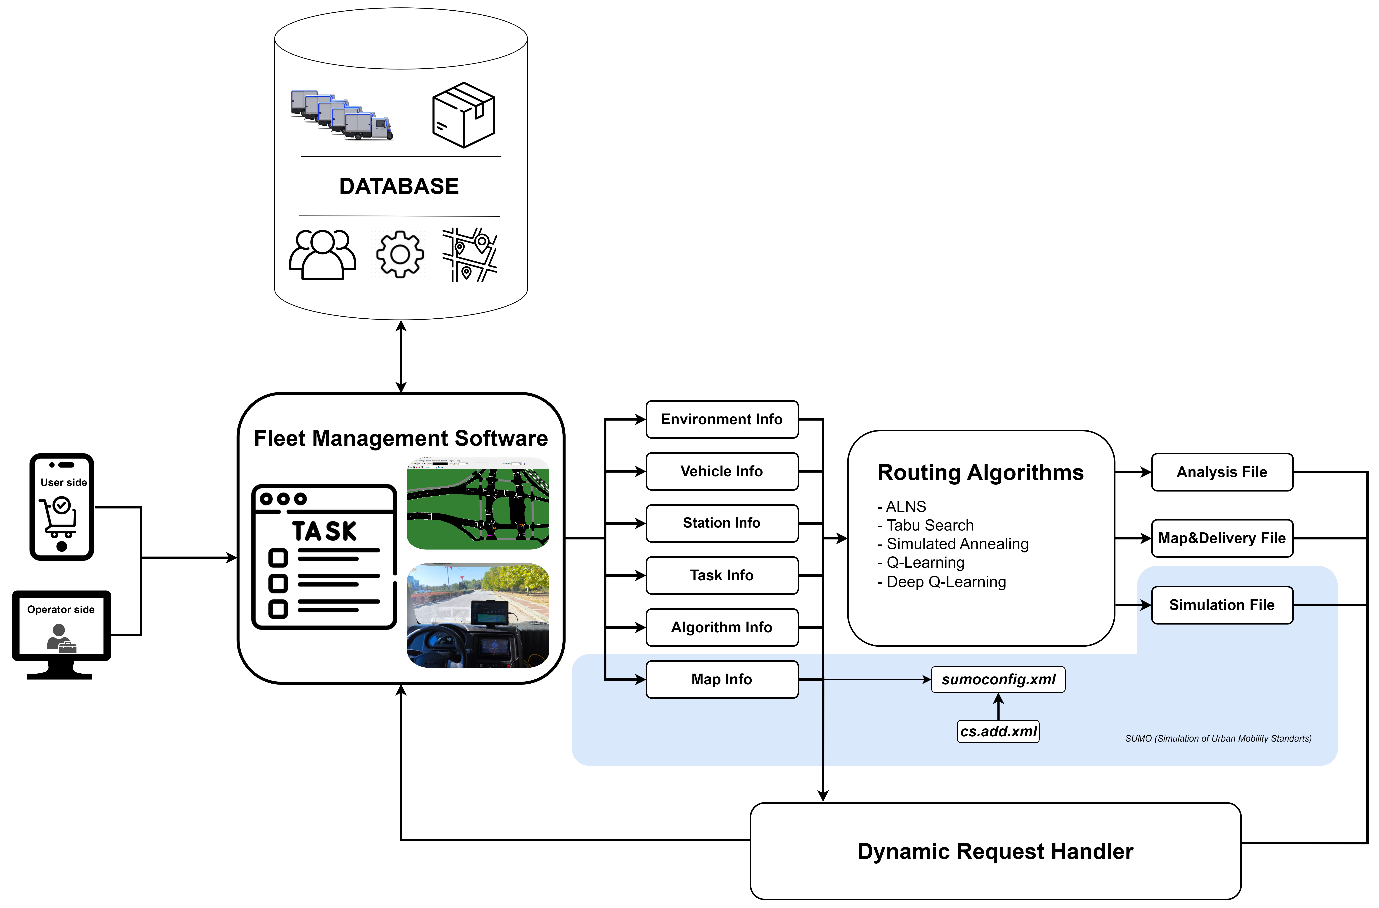
The fleet management system developed in this study has an integrated architecture that combines physical vehicles, simulation environments, route optimization algorithms, and user interface components. The architecture is shown in Figure 1.
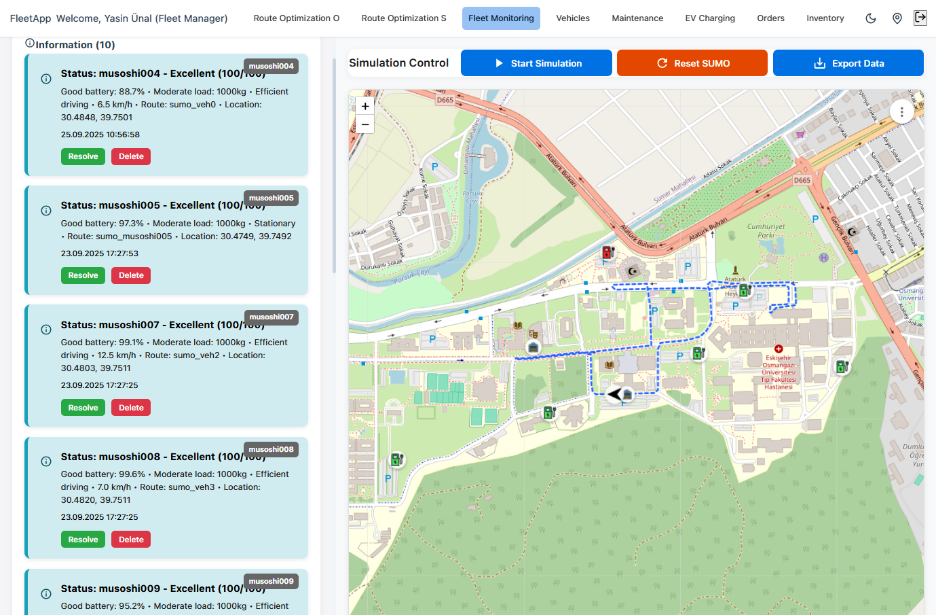
The system architecture is designed as an integrated structure that includes the planning, execution, and monitoring of delivery operations. The system consists of data, route optimization, fleet monitoring, maintenance, etc. components. Predetermined orders are transferred to the route optimization module in the specified data format. The route obtained by the selected algorithm is sent to the fleet monitoring module in order to make it possible to visualize for the fleet manager (Figure 2).
As shown in Figure 2, the Fleet Monitoring Module provides to fleet manager routes for different objective functions such as minimizing total distance, minimizing total energy etc. The fleet manager also monitors each vehicle’s location, speed, battery status, and real-time load on the map. Furthermore, the system’s Maintenance module monitors vehicle periodic service schedules, tire status, and potential malfunctions, maximizing fleet operational efficiency.
The Route Optimization Module consists of two basic structures: static planning and dynamic planning. In this study, the ALNS algorithm is used to obtain the initial route plan. ALNS is a metaheuristic algorithm that has proven particularly successful in solving large-scale combinatorial optimization problems and is widely used in the literature. Unlike the classical VRP, ALNS is an effective approach for solving the Capacitated Electric Vehicle Routing Problem with Time Windows (CEVRPTW), in which charging stations are also taken into account. Developed by Ropke and Pisinger (2006), ALNS generates improved neighboring solutions by modifying the current solution through removal and repair operators [26]. Owing to the flexible use of different heuristic operators, this method enables a more effective exploration of the solution space and increases the likelihood of selecting successful operators. Santini et al. (2018) extensively examined acceptance criteria of ALNS, while Turkes et al. (2021) analyzed adaptive mechanisms and weight updates [27,28]. In addition, Mara et al. (2022) presented the general framework of the method, and Voigt (2024) evaluated common and effective operators [29, 30]. In this study, a static route plan is obtained using the hybrid ALNS algorithm proposed by Ünal et al. (2025) and Bozkurt Keser et al. (2025) [31, 32] (Figure 3).
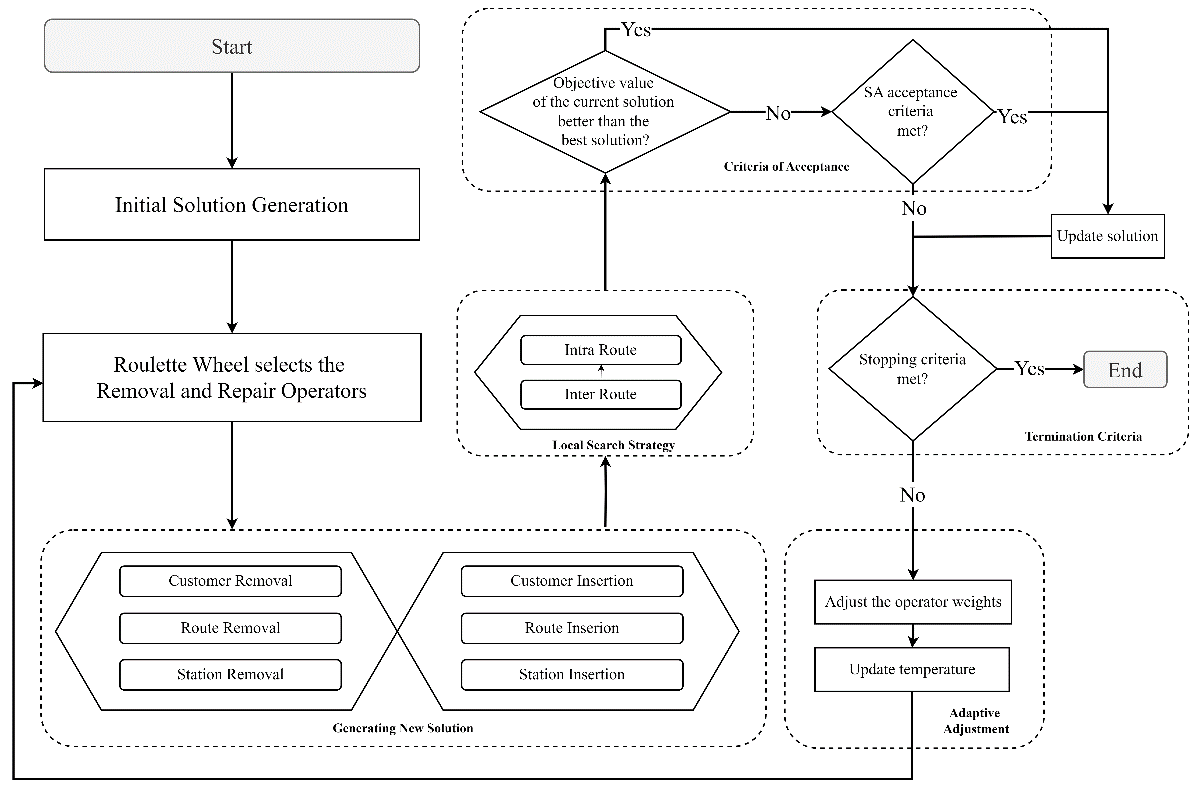
The flowchart of the ALNS algorithm is shown in Figure 3, and the corresponding removal and repair operators are presented in detail in [31, 32]. Obtained solutions are subsequently configured to accommodate unexpected situations such as vehicle failures. The system architecture is designed to respond to dynamic conditions such as vehicle failures, as shown in Figure 4.
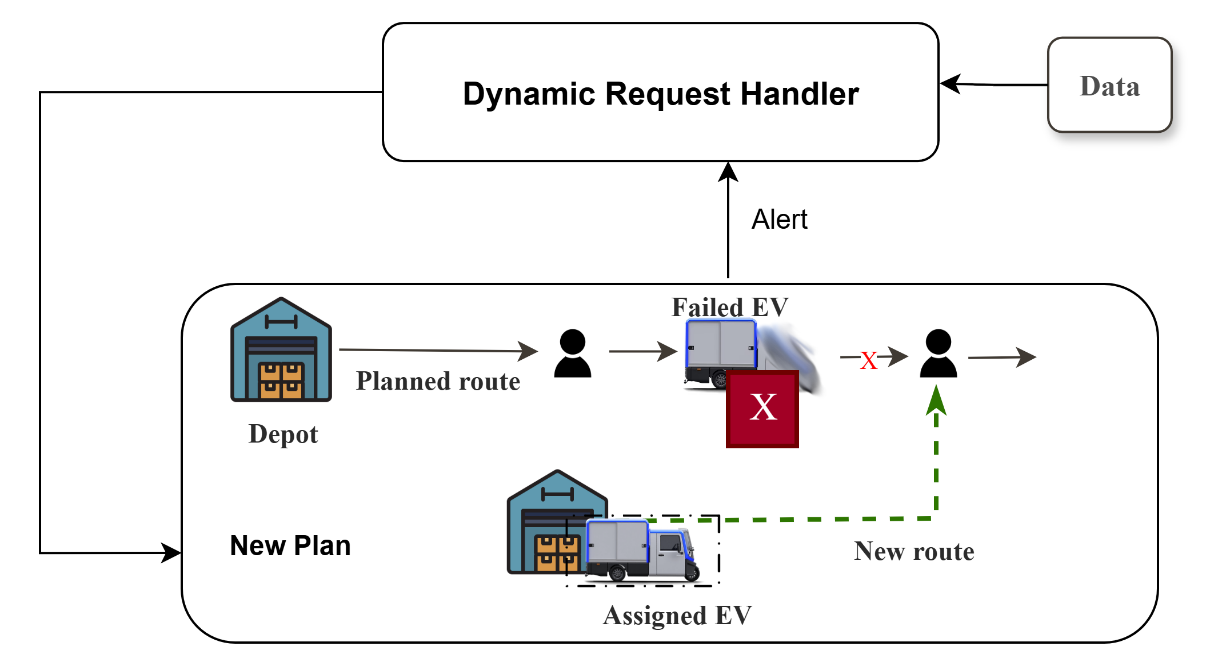
The vehicle executes the static plan generated by the routing optimization algorithm. During execution, an alert is generated regarding a vehicle failure. The Dynamic Request Handler checks whether other vehicles assigned to the route can perform the remaining tasks, taking into account unserved customers. If the assigned vehicles are unable to perform the task, it assigns a new vehicle from the depot to the route.
An XML-based RML schema is designed to standardize all information required for route planning by organizing six fundamental input categories; environmental conditions, vehicle characteristics, charging infrastructure, delivery tasks, algorithm configurations, and map-related data under a single structure. The structure is given Figure 5.
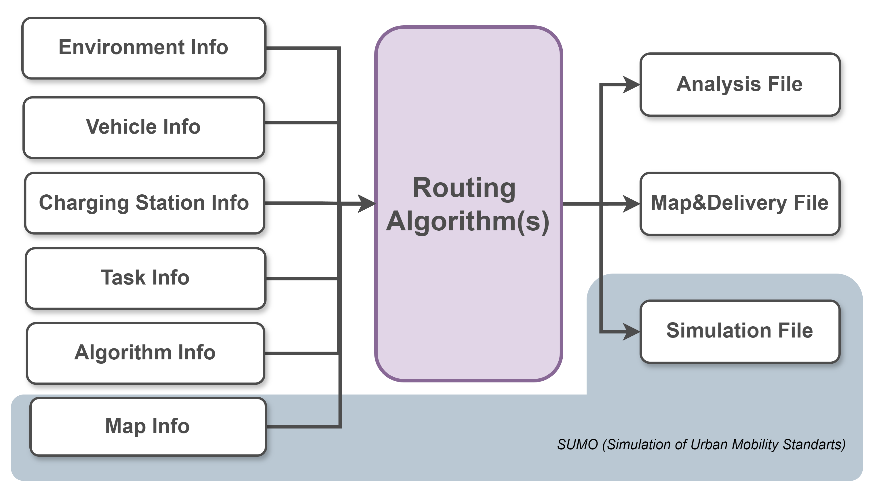
As shown in Figure 5, these inputs are collectively sent to the routing algorithm, which produces three standard outputs. The first output contains detailed route performance metrics that support fleet-level analysis. The second output provides a structured map and delivery file containing customer locations, route waypoints, and related instructions for use by fleet management systems or in-vehicle navigation units. The third output is a simulation-ready file designed for traffic simulation tools such as SUMO, enabling analyses and scenario testing. When the delivery process begins, the relevant in-vehicle data package is transmitted to the relevant vehicle, providing the coordinates of the delivery points, customer requests, and the sequence of road segments to be followed. A “visited” status is maintained for each delivery point, enabling both the vehicle and the central fleet management platform to track task completion in real-time. This unified design not only supports the execution of pre-optimized static plans but also facilitates dynamic updates during operations, ensuring that changing customer requests or operational conditions can be seamlessly incorporated.
The developed system architecture is structured to respond not only to static route plans but also to unexpected situations that may arise during the distribution process in real time. The two-stage structure allows route plans to be optimized at the outset and dynamically updated during execution. One scenario, the vehicle failure, is a critical situation that tests the system’s routing capabilities. During the delivery process, a vehicle in the fleet is unable to complete its pre-planned customer deliveries due to an accident, mechanical failure, or other reasons. Therefore, the system attempts to allocate the remaining delivery slots to a vehicle currently in distribution. Thus, the system begins by triggering an alert when the fleet manager selects the failed vehicle in the system. The Dynamic Request Handler component is activated to assign the most appropriate vehicle to the customers for whom delivery cannot be made. Representation of the process is shown in Figure 6.
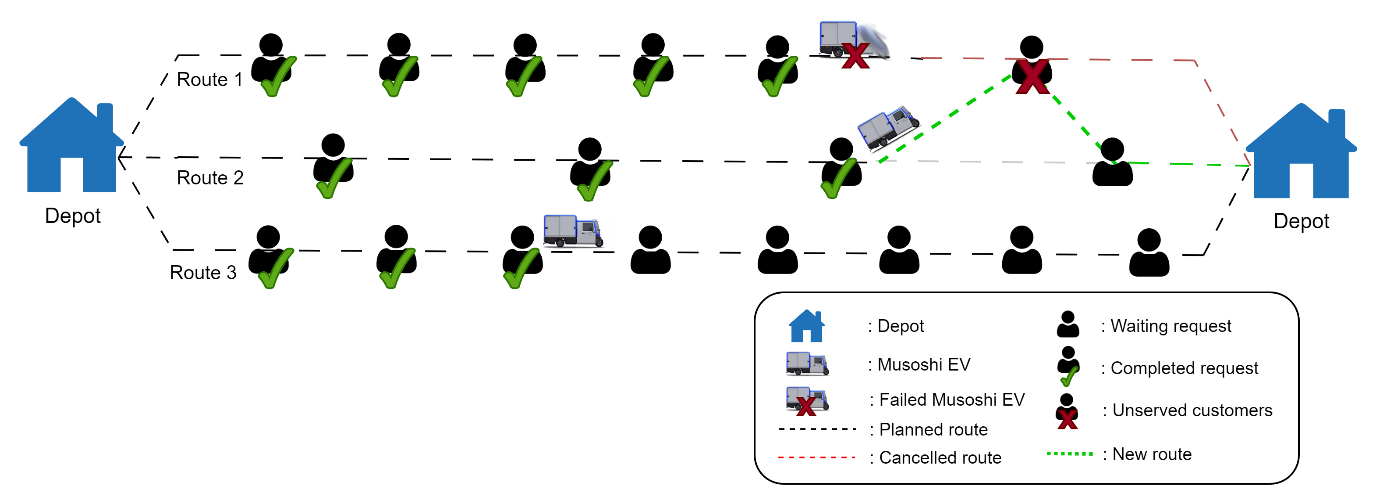
In Figure 6, a vehicle breakdown occurring shortly after departure from the depot can make reassigning the failed vehicle’s deliveries impossible. Such a reassignment is often infeasible because vehicles in the distribution fleet are typically scheduled at or near their maximum capacity. Consequently, if the remaining fleet lacks sufficient capacity to absorb the interrupted deliveries, a backup vehicle is dispatched from the depot. The backup vehicle assumes the original route, beginning with the first customer affected by the disruption. The described recovery process is illustrated in Figure 7.
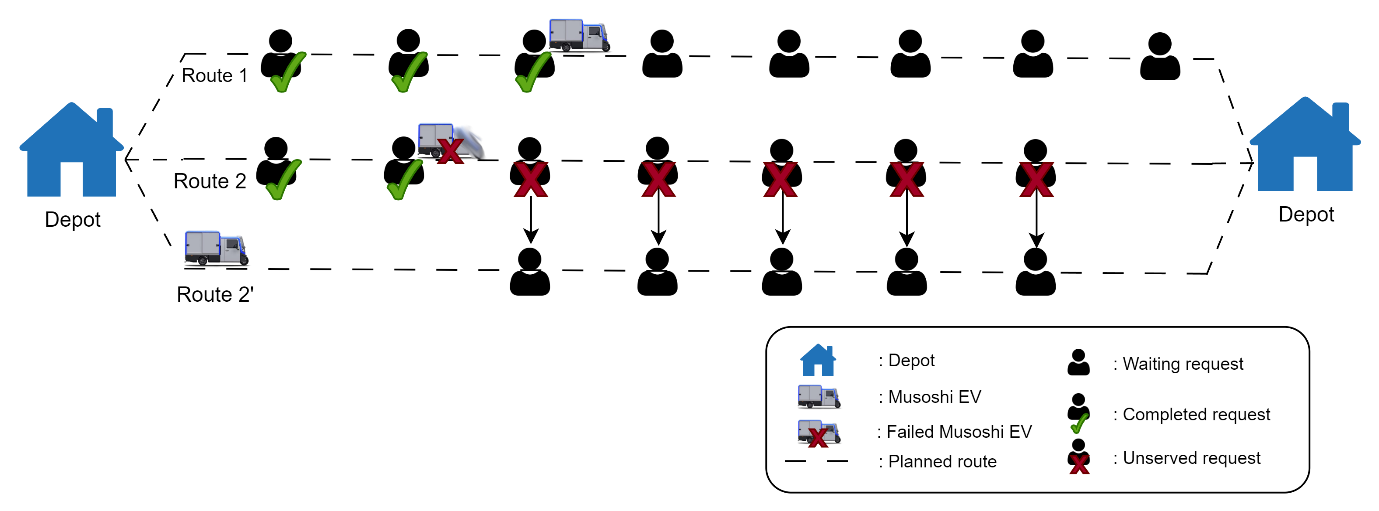
In Figure 7, the planned route content is updated, and a new route plan, a new simulation file, and new vehicle data are generated. Thanks to the mechanism, the system restores route integrity with the lowest possible latency and cost. The method that enables this dynamism in the route optimization module is given in Algorithm 1.
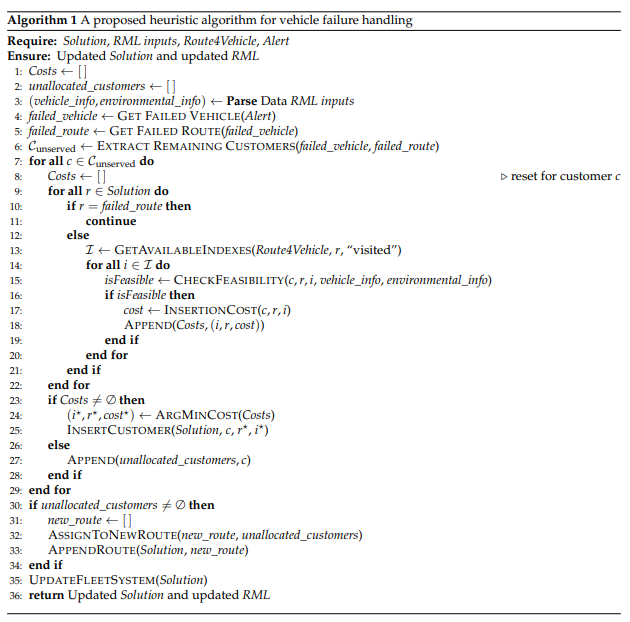
In Algorithm 1, the vehicle failure heuristic uses the proposed data standard and relevant information from the alert to identify the vehicle. Because each vehicle has a route, there are customers whose delivery has not been completed on the failed vehicle’s route. For the customers mentioned, checks are made to assign them to the route plans of other candidate vehicles in distribution, ensuring that load capacity, battery capacity, and time constraints are met. If feasible additions are available, the placement cost is calculated, and additions are made. If no feasible additions are found, a new vehicle departs from the depot, and unserved customers are added to the new route plan.
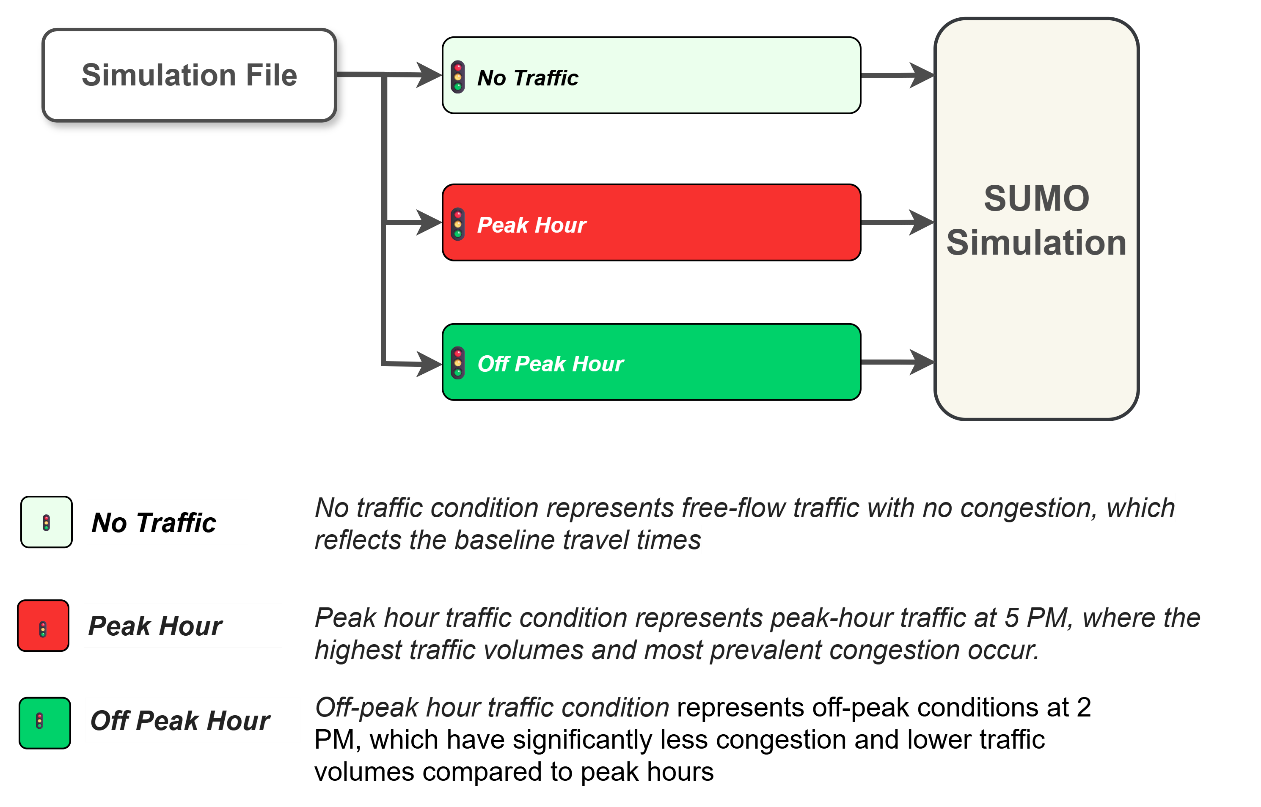
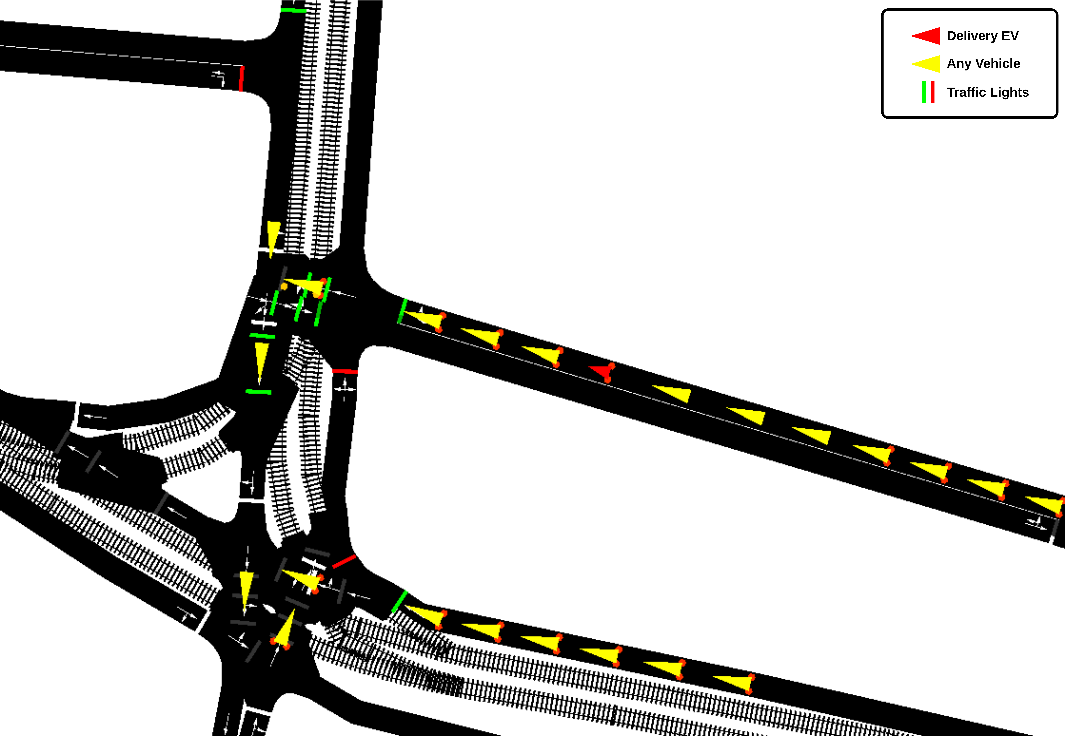
A key component of the study is the ability to run the resulting route in a SUMO simulation using the obtained simulation files. Routes executed in the SUMO environment are analyzed. Figure 8 shows how the proposed data standard and the resulting simulation files are run in SUMO under different traffic environments. Using variants of the simulation, generated for different traffic conditions, routes representing the changing nature of urban driving dynamics are shown in Figure 8.
In the simulation environment, only fleet vehicles travel under “No Traffic” conditions, without any interference from background traffic. The condition provides a basis for understanding the theoretical best-case performance in terms of travel time and energy consumption and eliminates external factors. Off-peak hour simulates off-peak traffic conditions at the study site during the 2:00 PM to 3:00 PM timeframe. Lower traffic volumes are expected throughout the network, resulting in little or no congestion, allowing evaluation of route efficiency under relatively favorable urban driving conditions. Peak hour, typically between 5:00 PM and 6:00 PM, models evening peak hour traffic conditions and is characterized by the highest traffic volumes and the time when congestion is most prevalent and severe (Figure 9).
As seen in Figure 9, peak hour traffic is a situation where the traffic is very crowded, and the traffic lights cause an increase in waiting times. Simulating under peak hour conditions is crucial for understanding the impact of heavy traffic on delivery times, vehicle energy consumption (especially for EVs due to frequent stop-and-go movements), and overall operational costs. The three traffic conditions studied are designed to assess the sustainability and robustness of the route optimization strategy under varying urban conditions. The simulation infrastructure integrated into the fleet management system allows for re-evaluation of routes under different traffic levels, enabling route quality to be measured not only theoretically but also in practical terms.
The geographic data used in the study is obtained using OpenStreetMap (OSM) and SUMO in the Büyükdere neighborhood of Eskişehir. A depot location is defined hypothetically in the network. Customer information, such as location and demand, is selected from the daily delivery locations of a water distribution company in Eskişehir. The operational context involves the distribution of a standardized product (bottled water), which is not unique to each customer. Therefore, it is assumed that the vehicle starts its distribution route from the depot fully loaded to its maximum capacity. The company’s orders are examined throughout a business day, and orders that have time windows of half an hour. The environment, includes all customer locations, charging infrastructure, and the location of the depot. Parameters of the vehicle used in the study are given in Table 1.
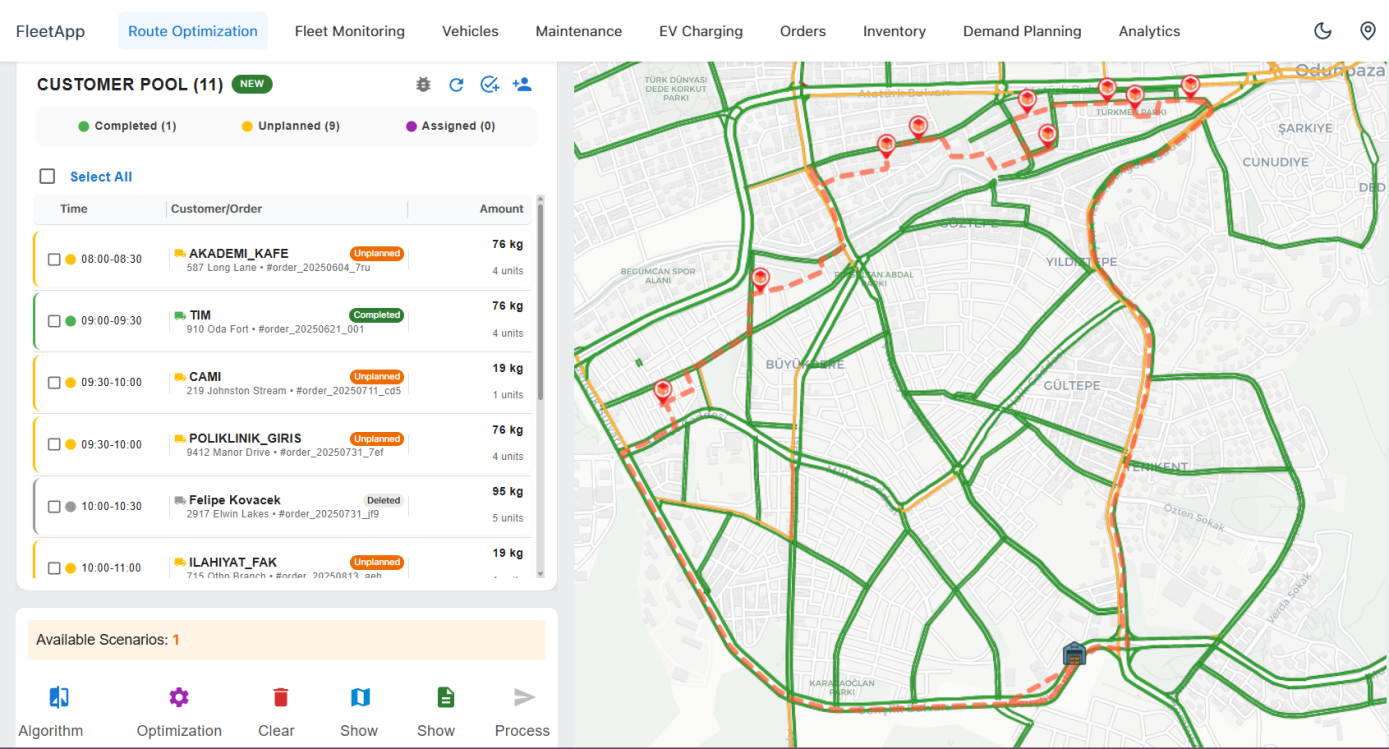
In Table 1, the vehicle model is based on the technical specifications of the Musoshi Pop-up Mini, which is an L5-type urban distribution vehicle. Previous studies based on actual field tests on the vehicle provided detailed analysis, particularly on energy consumption rates and range estimations [33, 34]. Customer orders in the test environment are based on orders placed between 8:00 AM and 6:00 PM on a typical business day. Orders placed before noon (8:00 AM – 18:00 PM) are defined in the system using 30-minute plans and optimized using the ALNS algorithm. Figure 10 shows the results captured from the fleet management software.
| Vehicle Picture | |
|---|---|
| Vehicle Info | Musoshi Pop-up Mini |
| Battery Capacity (Wh) | 15,600 |
| Maximum Load Capacity (kg) | 400 |
| Vehicle Mass (kg) | 700 |
| Maximum Speed (km/h) | 50 |
In Figure 10, the fleet management system includes the customer pool, route map, and route results. The route obtained on the map is displayed in real-time traffic conditions. Below the map, metrics related to the route are displayed. The optimization results are based on a distribution scenario carried out with EVs for nine customers in the system between 11:00 and 11:30. The total distance of the route is 8475 m, and the resulting energy consumption is 846 Wh. As a result of the route optimization, no charging is required. Therefore, no charging station is added to the route plan. With a processing time of approximately 15 seconds, the algorithm demonstrated suitable performance for real-time applications. The routes assigned to vehicles can be viewed by the fleet manager to track delivery statuses. Details about the routes assigned to each vehicle and the completion status of deliveries are presented to the fleet manager via a dashboard (Figure 11).
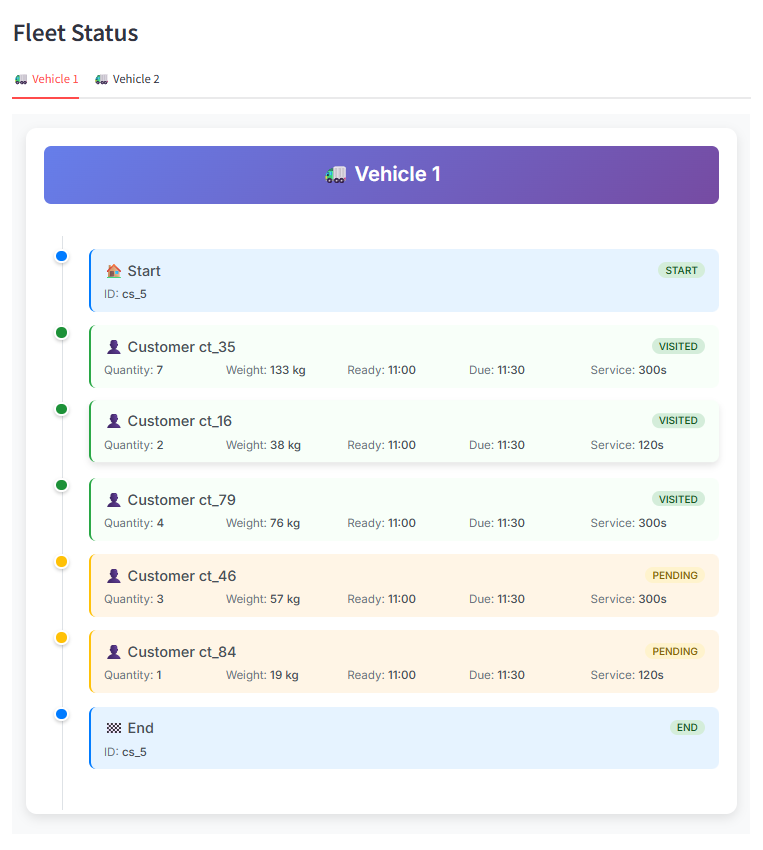
In Figure 11, route order details are retrieved from the data package. Deliveries with a green background indicate that the delivery has been completed, while those with a yellow background indicate that the delivery has not been made yet.
A real-life vehicle failure scenario is simulated in the fleet management system when the fleet manager initiates the relevant process on the interface. When the process is triggered, the vehicle failure heuristic runs. Route details for the vehicle failure are retrieved, and assignments are made for customers whose deliveries cannot be completed based on two test cases. If none of the vehicles in distribution have additional load, a new vehicle is taken from the depot to complete the remaining deliveries (Figure 12).
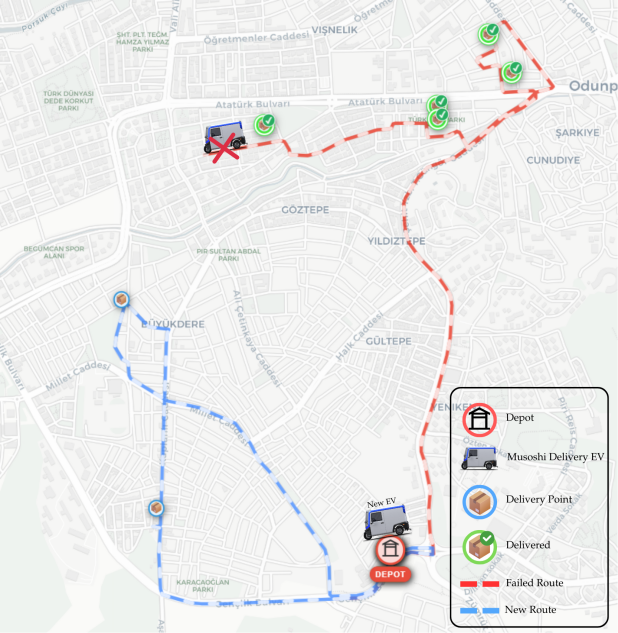
In test Case 1, since no other vehicles are available for distribution or are unavailable, a new vehicle taken from the depot takes over the remaining delivery task. However, in real life, although there may be multiple vehicles in the delivery environment, taking a new vehicle from the depot may not always be possible due to operational costs. Alternatively, the fleet size may be limited. In this case, customers who have not been serviced can be assigned to vehicles already in distribution. This test case is shown in Figure 13.
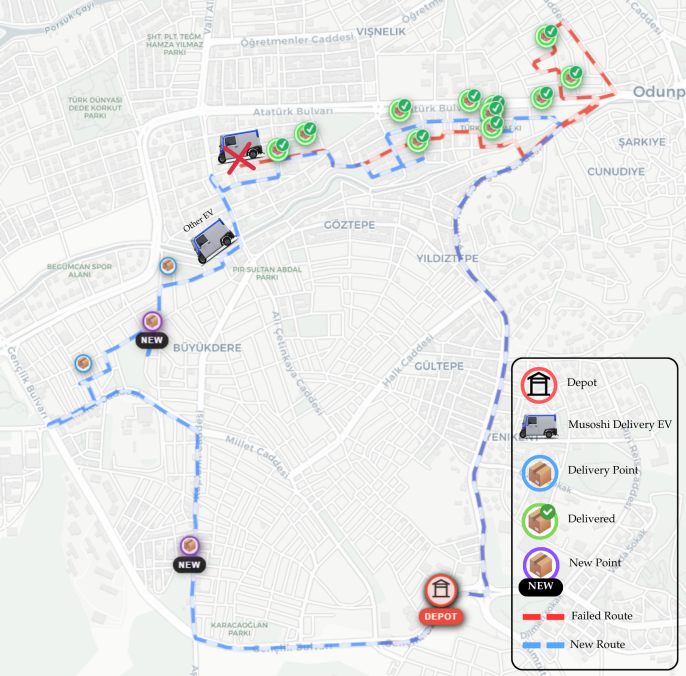
In test Case 2, another EV that is on its way and about to be delivered, assigned the two deliveries of the failed EV in addition to its own route. The two customers assigned to the route are shown on the map as new. The situation ensured that the failure is handled and customer satisfaction is maintained without increasing operational costs by deploying a new vehicle.
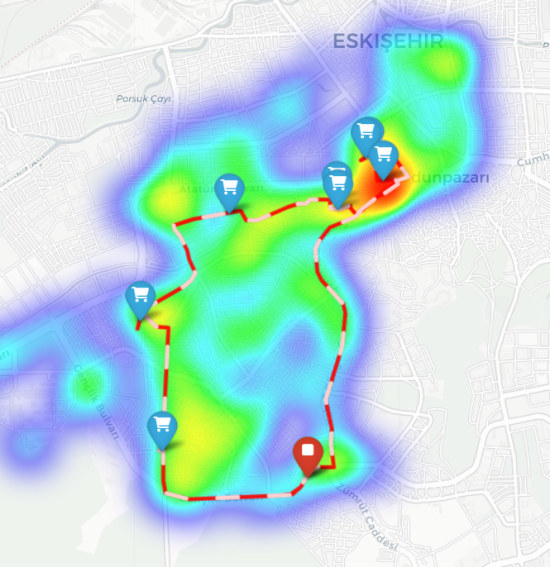
Traffic congestion is known to be one of the most critical external factors directly affecting the efficiency and on-time delivery performance of urban logistics operations. One of the primary objectives of this research is to systematically model and analyze the effects of varying traffic conditions on optimization performance. Real-world data from the Büyükdere neighborhood is used to form a basis for simulation scenarios. The study constructed an idealized baseline scenario, labeled “no traffic” along with two other scenarios representing a range of operational conditions: “off-peak hours” and “peak hours”. A heat map is created for the peak hour scenario to reveal the distribution of traffic congestion along the route. The heat map, presented in Figure 14, shows the critical points and traffic accumulation points along the planned route.
The heat map provides a glimpse into the geographic extent of the problem. However, to fully understand the operational consequences of traffic congestion, a numerical assessment is essential. In this context, the tardiness metric, a key performance indicator of service quality, is used. Tardiness values calculated in seconds for all customers under each scenario are compiled in Table 2 to provide an empirical basis for subsequent analyses. The table provides a perspective on the impact of increased traffic congestion on individual delivery tasks.
| Customer | Task Time | No Traffic Tardiness (s) | Off Peak Hour Tardiness (s) | Peak Hour Tardiness (s) |
|---|---|---|---|---|
| ct_95 | 09.30-10.00 | 134 | 187 | 196 |
| ct_116 | 09.30-10.00 | 423 | 728 | 737 |
| ct_128 | 09.30-10.00 | 633 | 938 | 947 |
| ct_102 | 10.00 – 10.30 | 130 | 145 | 145 |
| ct_160 | 10.00 – 10.30 | 516 | 531 | 531 |
| ct_114 | 10.00 – 10.30 | 921 | 936 | 939 |
| ct_136 | 10.00 – 10.30 | 1122 | 1137 | 1140 |
| ct_257 | 10.30 – 11.00 | 327 | 425 | 801 |
| ct_201 | 11.00 – 11.30 | 98 | 103 | 117 |
| ct_154 | 11.30 – 12.00 | 185 | 199 | 196 |
| ct_216 | 11.30 – 12.00 | 0 | 0 | 163 |
Analysis of the data presented in Table 2 reveals a strong and positive correlation between traffic density and tardiness. The findings are further illustrated by the aggregated results graphs in Figure 15. An examination of the graphs (Figure 15-a) reveals that the total tardiness, which is 5329 seconds in the off-peak hour scenario, climbs to 5912 seconds in the peak hour scenario. This indicates a significant deterioration in service quality exceeding 10%. Further analysis reveals that tardiness is not uniformly distributed throughout the day, suggesting that the system is more sensitive to morning traffic increases.
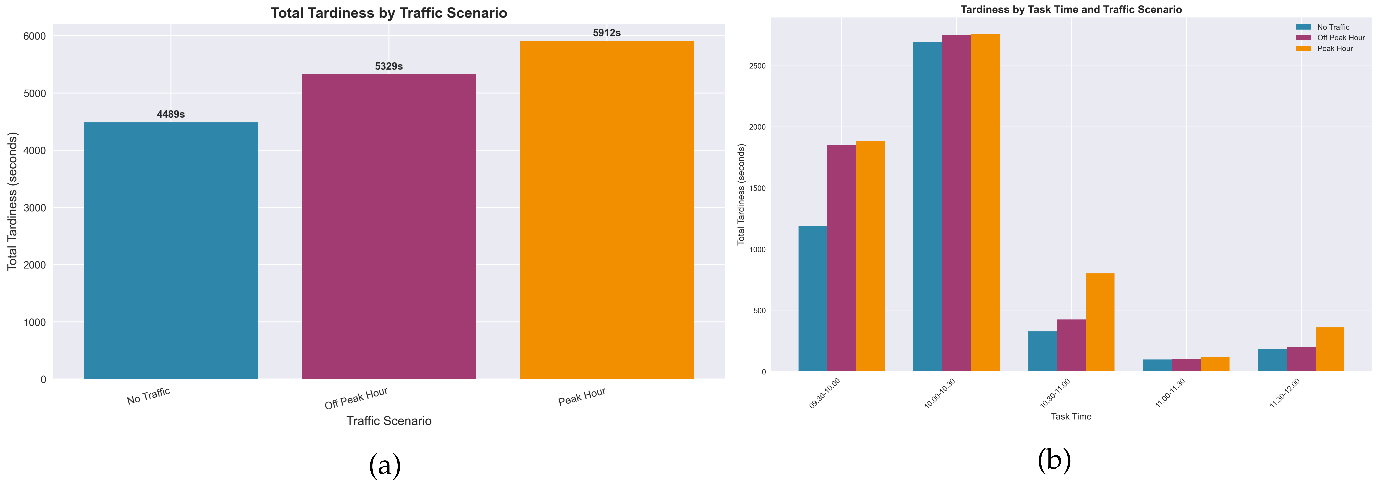
The analysis in Figure 15 reveals that tardiness is clustered both at specific locations and within specific timeframes (Figure 15-b). Dynamic traffic conditions may cause a difference between the planned and actual routes in considering the static plan. To increase the system’s flexibility and efficiency, it is critical that future developments integrate rescheduling strategies based on time windows that account for traffic density at different times of day.
To conduct a more comprehensive analysis, three different problem sets consisting of 20, 60, and 100 customers are created. For each problem set, two different vehicle breakdown scenarios occurring at the start and end of the route are evaluated. Two strategies are tested for each failure situation. In the first strategy, all remaining deliveries of the failed vehicle are assigned to a new vehicle leaving the depot. In the second strategy, the remaining customers of the failed vehicle are first distributed among other vehicles already making deliveries (Helper Vehicle), and customers that could not be assigned to vehicles in delivery are directed to the new vehicle leaving the depot. Furthermore, simulations are conducted under No Traffic and Peak Hour traffic conditions on these problem sets and failure scenarios to analyze the impact of traffic. The observed results are presented in Table 3 and Table 4.
Static plans for each problem set are calculated using the ALNS algorithm. The static plan generation process took approximately 6.87 seconds, 28.48 seconds, and 54.80 seconds for the 20, 60, and 100 customer examples, respectively. The system demonstrates that the algorithm scales reasonably well as the problem size increases. In failure scenarios, the system’s response time is extremely fast (typically between 0 and 1 second), as only local reconfiguration and reassignment operations are performed, rather than recalculating the entire plan from scratch. The experimental results obtained from both the No Traffic and Peak Hour conditions reveal consistent performance differences between the two failure-recovery strategies. Across all problem sizes, redistributing the failed vehicle’s remaining customers to active vehicles before dispatching a new one generally leads to shorter completion times and a more balanced operational load. This effect is visible even in small instances (20 customers), but becomes more pronounced as the number of customers increases, particularly when the failure occurs late in the route. In contrast, the naive “always send a new vehicle” strategy tends to suffer from additional detours and longer travel times, especially under peak-hour congestion, where traffic amplifies every additional kilometer that a newly dispatched vehicle must travel from the depot. The peak-traffic simulations clearly highlight this effect: several instances show substantial improvements when using the helper-vehicle strategy, demonstrating that leveraging vehicles already positioned within the road network is significantly more advantageous than introducing a new vehicle into congested streets. Overall, the findings confirm that proactive redistribution not only mitigates the negative impact of unexpected failures but also provides greater robustness against traffic-induced delays, resulting in consistently faster route completion across a wide range of operational scenarios.
| Static Plan | Failure (No Traffic) | |||
|---|---|---|---|---|
| Problem# | Runtime (s) | Location of Failure | Completion Time (Cmax) (s) | |
| Send New Vehicle | Send Helper + New Vehicle | |||
| 20 C* | 6.872 | Start of the Route | 2921 | 2822 |
| 20 C* | End of the Route | 3119 | 2893 | |
| 60 C* | 28.483 | Start of the Route | 3521 | 3098 |
| 60 C* | End of the Route | 3345 | 3345 | |
| 100 C* | 54.801 | Start of the Route | 2797 | 2774 |
| 100 C* | End of the Route | 2774 | 2774 | |
| C* indicates customers | ||||
| Static Plan | Failure (Peak Hour Traffic) | |||
|---|---|---|---|---|
| Problem# | Runtime (s) | Location of Failure | Completion Time (Cmax) (s) | |
| Send New Vehicle | Send Helper + New Vehicle | |||
| 20 C* | 6.872 | Start of the Route | 3309 | 3094 |
| 20 C* | End of the Route | 3966 | 3170 | |
| 60 C* | 28.483 | Start of the Route | 5183 | 5919 |
| 60 C* | End of the Route | 5050 | 3516 | |
| 100 C* | 54.801 | Start of the Route | 5545 | 2893 |
| 100 C* | End of the Route | 3309 | 3094 | |
| C* indicates customers | ||||
Managing urban logistics operations is becoming increasingly challenging due to traffic congestion and operational uncertainties. This study presents a fleet management framework that can operate effectively under such dynamic conditions. The proposed system not only creates static routes but also responds to unexpected events that may arise during operations, such as vehicle breakdowns. The data standard used within the system ensures consistent information flow between modules, thereby enhancing interoperability and overall system efficiency. The system’s dynamic structure enables real-time processing of field data, adaptation to changes, and revision of route plans when disruptions occur. Fleet Monitoring allows continuous vehicle tracking and provides fleet managers with real-time decision support by monitoring traffic delays. A comprehensive series of experiments is conducted to evaluate the system’s ability to respond to failure events and varying traffic conditions. The results show that the strategy of assigning customers to vehicles already actively engaged in distribution improves operational efficiency before dispatching new vehicles. This improvement is more pronounced during peak traffic congestion. Additionally, static planning times ranging from approximately 7 to 55 seconds for customer problem sizes between 20 and 100 indicate that the ALNS algorithm scales reasonably well. The system’s response time during failure events remains extremely low (0-1 seconds), confirming its suitability for real-time decision-making.
In conclusion, this study presents a flexible and robust framework that integrates route optimization, fleet tracking, and traffic analysis under a single structure. The proposed system enhances the reliability of last-mile delivery services while also improving operational visibility and control. Future research will focus on enriching the system with live traffic feeds, more comprehensive dynamic event management, and broader real-world deployment scenarios, further strengthening its applicability in urban logistics.