Precision agriculture has revolutionized field management techniques, integrating the use of sensors, automation, geospatial data, and quantitative decision-making. Monitoring, mapping, spraying, disaster assessment, logistics, and other field activities are currently done using UAVs because they offer fast access, versatility of use, and high-resolution imagery [1–4]. In crop spraying, UAVs help avoid the exposure of operators to pesticides, give better access to difficult-to-reach areas, and enable a more precise pesticide and fertilizers application when proper equipment is chosen for specific operational conditions [3,5,6].
The increasing number of available agricultural spraying UAVs makes the equipment selection harder, as commercial machines vary greatly in terms of payload capacity, work efficiency, flight duration, flow rate of spray, capacity of the tank, battery capacity, spray width, transmission range, weight of the vehicle, and charge time. All these characteristics are heterogeneous in scale and orientation; hence, increased payload capacity can lead to better coverage per single flight, while higher weight can make the equipment less convenient for field operations. Improved range gives more operational possibilities to UAVs, while quick charge means lower downtime before the next mission. A decision based on one criterion only would be misleading if the task was to select the equipment with the best overall operating profile.
Multi-criteria decision analysis can be effectively applied to solve such a task, as it transforms heterogeneous criteria into comparable measures and combines them based on explicit weights. AHP is widely used to get the weights of criteria from pairwise comparisons and to validate the consistency of judgement of a decision maker [7–10]. TOPSIS ranks alternatives by their proximity to the positive and negative ideal solutions, MABAC assesses alternatives by the distance to the approximating border area, while ARAS calculates the utility degree of alternatives relative to the ideal one [11–16]. These approaches have been applied in aviation, logistics, emergency services, energy systems, and UAV selection [17–22].
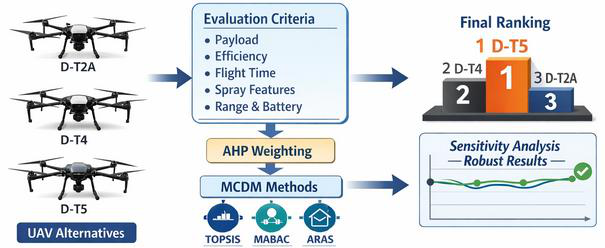
The majority of UAV selection studies are based on one ranking approach. It means that the choice is sensitive to the normalization rule, reference point, or aggregation procedure used in this method. The comparative evaluation of several approaches is helpful because the same alternatives will be assessed using different mathematical approaches. Sensitivity analysis is required as well, because AHP-based weights are judgement-based and different for various decision-makers. The current study aims to address both issues by using a combination of AHP and TOPSIS, MABAC, and ARAS methods and verifying whether changing the two highest criterion weights would lead to the change in the final ranking of alternatives. Figure 1 shows the decision procedure.
| Methodological focus | Research focus | Reference |
|---|---|---|
| Fuzzy ANP and Choquet integral | Aircraft procurement evaluation using fuzzy preference information | [17] |
| Mathematical programming and clustering | Route planning for UAV operations in disaster zones | [23] |
| MCDM review | Classification of decision-making applications in the aviation industry | [18] |
| UAV disaster-management review | Assessment of UAV capabilities and applications in disaster management | [24] |
| Interval-valued fuzzy TOPSIS | Last-mile delivery drone selection using multiple operational criteria | [19] |
| DEMATEL, fuzzy ANP, and AHP | Identification of dominant factors and sustainable value requirements for civilian-use drones | [25,26] |
| Game theory and emergency logistics | Planning support for natural-disaster response and humanitarian operations | [27,28] |
| AHP and TOPSIS | Drone and aircraft selection under technical and economic constraints | [20,29] |
| PROMETHEE, TOPSIS, AHP, and related models | Cargo-drone and firefighting-drone selection for emergency intervention | [30,31] |
| Bayesian network, MABAC, and logistics models | UAV performance assessment and drone selection for logistics, medical supplies, and flood response | [21,32,33] |
| Decision models for sustainable logistics | Last-mile logistics and drone-delivery studies in complex urban contexts | [34,35] |
| LOPCOW, VIKOR, TOPSIS, and AHP | Agricultural UAV selection and scheduling for precision-agriculture applications | [22,36] |
What sets apart this paper from others is the internally consistent incorporation of AHP weighting into ranking of UAVs for agricultural spraying by means of three different ranking techniques. The contributions of this paper include the following. First, the alternatives are evaluated with a set of criteria representing such factors as spraying capacity, field productivity, endurance, energy supply, range, and supporting conditions. Second, the final rank of alternatives is verified by TOPSIS, MABAC, and ARAS techniques instead of depending on one ranking. Third, the robustness of the ranking results is checked by changing the values of the most impactful weights.
The decision problem involves three UAV alternatives represented by \(A_i\), where \(i=1,2,3\), and ten criteria represented by \(C_j\), where \(j=1,2,\ldots,10\). The decision matrix has the form \(X=[x_{ij}]\), where \(x_{ij}\) is the value of performance of alternative \(A_i\) in criterion \(C_j\). Criteria C1–C8 are considered as the benefit criteria since the higher value increases the operational capabilities. Criteria C9 and C10 are considered as the cost criteria because the lighter vehicle weight and the shorter charging time are required. The weight vector has the form \(w=(w_1,w_2,\ldots,w_{10})\), where \(w_j\geq0\) and \(\sum\limits_{j=1}^{10}w_j=1\).
AHP converts reciprocal pairwise comparisons into a priority vector. Let \(P=[p_{jk}]\) be the pairwise comparison matrix. The entries satisfy \(p_{jk}=1/p_{kj}\) and \(p_{jj}=1\). The priority vector is calculated from the principal eigenvector of \(P\):
The internal consistency of the pairwise comparisons is evaluated through the consistency index and consistency ratio:
where \(RI\) is the random index corresponding to the matrix size. A value of \(CR<0.10\) is generally accepted as sufficiently consistent for decision analysis [7–10].
TOPSIS first applies vector normalization:
and then obtains the weighted normalized matrix
For benefit criteria, the positive ideal value is \(v_j^+=\max_i v_{ij}\) and the negative ideal value is \(v_j^-=\min_i v_{ij}\). For cost criteria, these definitions are reversed. The separation measures and closeness coefficient are
A larger \(C_i\) indicates a better alternative [11–13].
MABAC uses linear normalization. For benefit criteria,
and for cost criteria,
where \(x_j^+\) and \(x_j^-\) are the best and worst criterion values. If all alternatives have the same value for a criterion, the normalized value is set to zero because the criterion does not discriminate among alternatives. The weighted matrix is
The border approximation area is calculated by the geometric mean
and the final MABAC score is
A larger \(S_i\) indicates a stronger alternative [14,37,38].
ARAS adds an optimal alternative \(A_0\) to the decision matrix. For benefit criteria, normalization is given by
and for cost criteria it is given by
The weighted matrix, optimality function, and utility degree are
A larger \(K_i\) indicates a utility degree closer to the ideal alternative [15,16,39,40].
| Method | Main role in this study | Main output |
|---|---|---|
| AHP | Derives criterion weights from reciprocal pairwise comparisons and checks consistency through \(CR\). | Weight vector \(w_j\) for the ten criteria. |
| TOPSIS | Measures each UAV according to its distance from the positive and negative ideal weighted profiles. | Closeness coefficient \(C_i\). |
| MABAC | Compares each UAV with the border approximation area for every criterion. | Overall distance score \(S_i\). |
| ARAS | Compares each UAV with an explicitly defined optimal alternative. | Utility degree \(K_i\). |
The sensitivity analysis is performed to evaluate how the ranking would be changed by changing the two dominating weights. Payload capacity and work efficiency are varied one after another. During each variation, the selected weight is kept at the test value, and other weights are normalized to maintain the same total sum as one. Then TOPSIS proximity coefficients are recalculated with the new set of weights. This approach allows us to check the dependence of the final ranking on a narrow weight combination.
This section describes the AHP weights, ranking results of TOPSIS, MABAC, and ARAS, and sensitivity analysis. The interpretation of the scores in relation to agricultural spraying is stressed rather than the numerical calculations.
Technical specifications used for the decision matrix are shown in Table 3. UAVs D-T4 and D-T5 have the biggest payload capacity and tank volume; D-T5 has the biggest work efficiency, spraying width and transmission range; D-T2A has the biggest flight time and smallest vehicle weight. This variety of trade-offs proves the need to use a multi-criteria decision method since none of UAVs is clearly dominant over all the criteria.
The result of pairwise comparisons of the AHP method is given in Table 4. The matrix gives preference to those criteria which define UAV productivity and mission capability. The calculated value of \(\lambda_{\max}\) equals 10.491, resulting in \(CI=0.0545\) and \(CR=0.0366\) with \(RI=1.49\). The consistency ratio being less than 0.10 indicates appropriate pairwise comparisons.
| Code | Criterion | Type | Unit | D-T2A | D-T4 | D-T5 |
|---|---|---|---|---|---|---|
| C1 | Payload capacity | Benefit | kg | 10 | 20 | 20 |
| C2 | Work efficiency | Benefit | \(m^2/\mathrm{min}\) | 800 | 1500 | 2200 |
| C3 | Flight time | Benefit | min | 20 | 14 | 15 |
| C4 | Spray flow rate | Benefit | L/min | 1.6 | 2.0 | 2.0 |
| C5 | Tank capacity | Benefit | L | 10 | 20 | 20 |
| C6 | Battery capacity | Benefit | Wh | 222 | 488 | 488 |
| C7 | Spray width | Benefit | m | 4 | 5 | 6 |
| C8 | Transmission range | Benefit | km | 1 | 1 | 2 |
| C9 | UAV weight | Cost | kg | 12.5 | 14 | 23 |
| C10 | Charging time | Cost | h | 1.25 | 1.25 | 1.25 |
| C1 | C2 | C3 | C4 | C5 | C6 | C7 | C8 | C9 | C10 | |
|---|---|---|---|---|---|---|---|---|---|---|
| C1 | 1 | 2 | 3 | 4 | 3 | 5 | 5 | 6 | 7 | 7 |
| C2 | 1/2 | 1 | 2 | 3 | 2 | 4 | 4 | 5 | 6 | 6 |
| C3 | 1/3 | 1/2 | 1 | 2 | 2 | 3 | 3 | 4 | 5 | 5 |
| C4 | 1/4 | 1/3 | 1/2 | 1 | 2 | 3 | 3 | 4 | 5 | 5 |
| C5 | 1/3 | 1/2 | 1/2 | 1/2 | 1 | 2 | 2 | 3 | 4 | 4 |
| C6 | 1/5 | 1/4 | 1/3 | 1/3 | 1/2 | 1 | 2 | 3 | 4 | 4 |
| C7 | 1/5 | 1/4 | 1/3 | 1/3 | 1/2 | 1/2 | 1 | 2 | 3 | 3 |
| C8 | 1/6 | 1/5 | 1/4 | 1/4 | 1/3 | 1/3 | 1/2 | 1 | 2 | 2 |
| C9 | 1/7 | 1/6 | 1/5 | 1/5 | 1/4 | 1/4 | 1/3 | 1/2 | 1 | 2 |
| C10 | 1/7 | 1/6 | 1/5 | 1/5 | 1/4 | 1/4 | 1/3 | 1/2 | 1/2 | 1 |
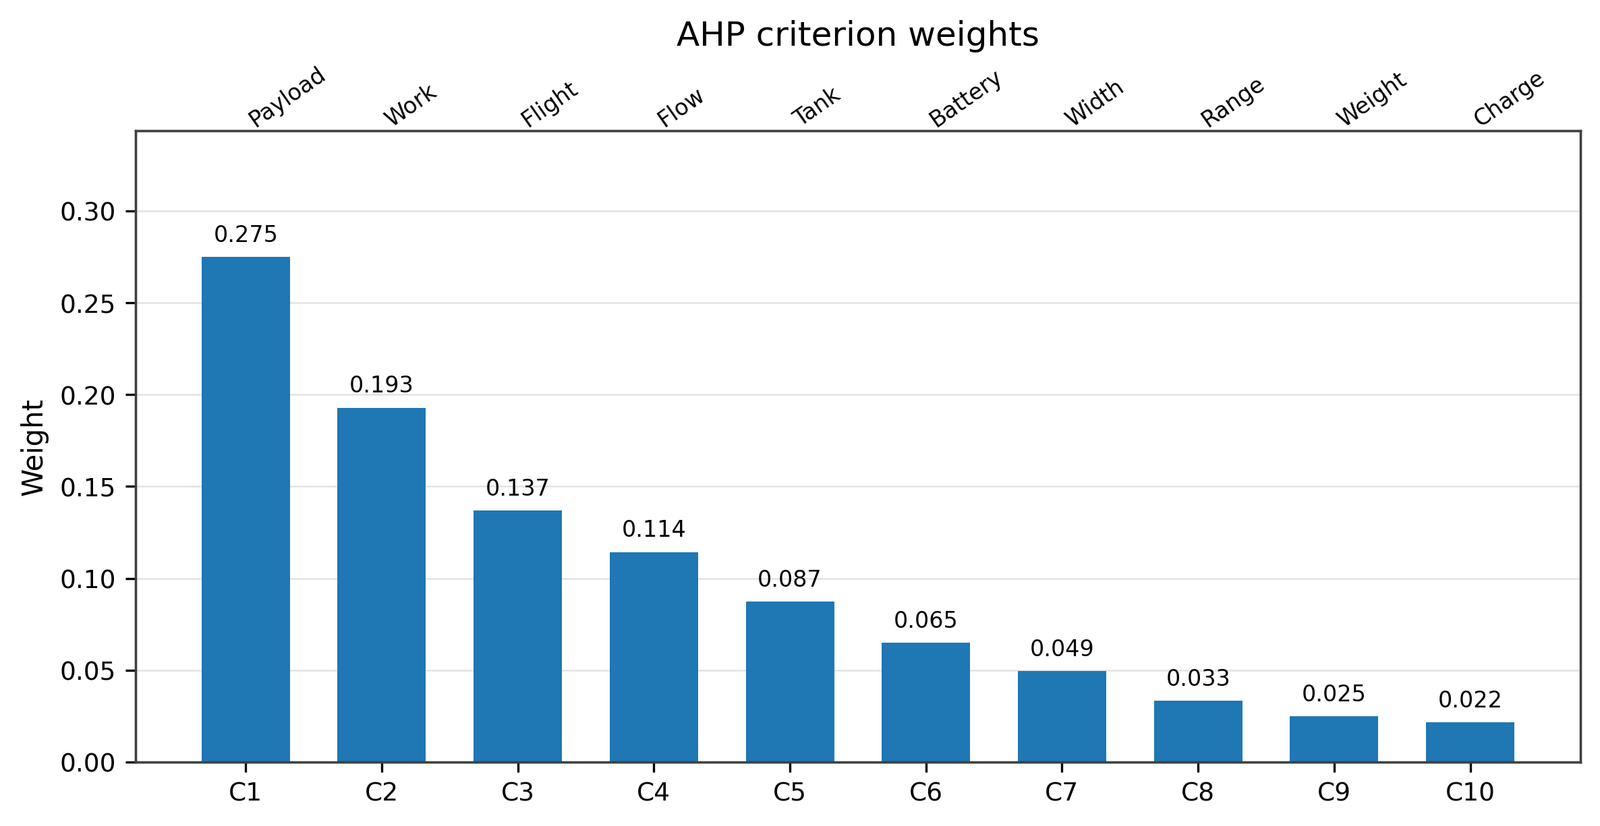
Weights calculated from AHP technique are represented in Figure 2 and Table 5. The criterion with the highest weight is payload capacity, which is followed by work efficiency, duration of the flight, and spray-flow rate. The sum of weights for all four criteria represents more than 70% of all weights. This outcome corresponds to the spraying process because the practical utility of the drone is highly influenced by its payload capacity, work efficiency, duration of operation, and spray-flow rate.
| Criterion | Description | Weight |
|---|---|---|
| C1 | Payload capacity | 0.275 |
| C2 | Work efficiency | 0.193 |
| C3 | Flight time | 0.137 |
| C4 | Spray flow rate | 0.114 |
| C5 | Tank capacity | 0.087 |
| C6 | Battery capacity | 0.065 |
| C7 | Spray width | 0.049 |
| C8 | Transmission range | 0.033 |
| C9 | UAV weight | 0.025 |
| C10 | Charging time | 0.022 |
| Total | 1.000 | |
The small importance of criteria of the vehicle weight and charging time does not mean that these criteria are unimportant. On the contrary, this means that within the current set of alternatives, the decision-makers are more concerned about the field performance of UAVs rather than support constraints. Charging time criterion has the smallest discriminating power since all three UAVs are equal on this criterion.
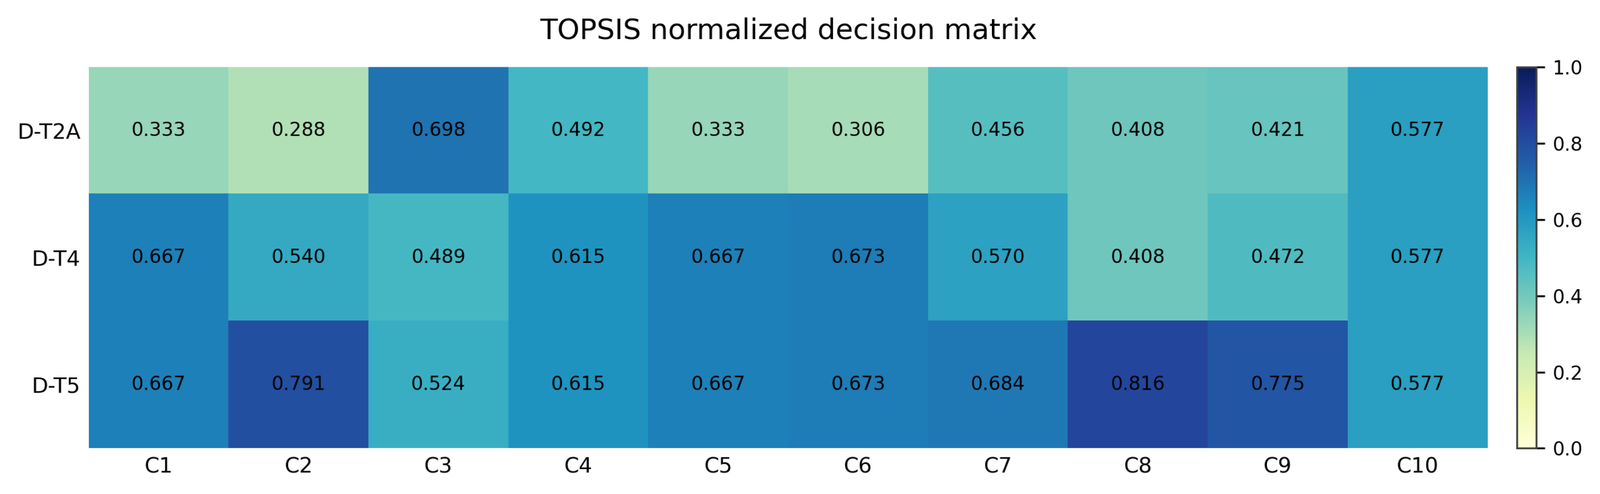
The vector-normalized matrix is presented in Figure 3. UAV D-T5 shows good results in terms of work efficiency, spray width, and transmission range; D-T2A has the best result in terms of flight time and good raw value of the criterion of vehicle weight. As C9 is the cost criterion, the impact of this criterion should be considered within the solution process of finding an ideal solution.
As we can see from Figure 4, after applying the AHP weights, the differences in payload capacity and work efficiency are the most influential factors in separation measures. Even though D-T2A has the best flight time, this does not help to overcome its disadvantages such as low payload capacity, tank capacity, battery capacity, and work efficiency.
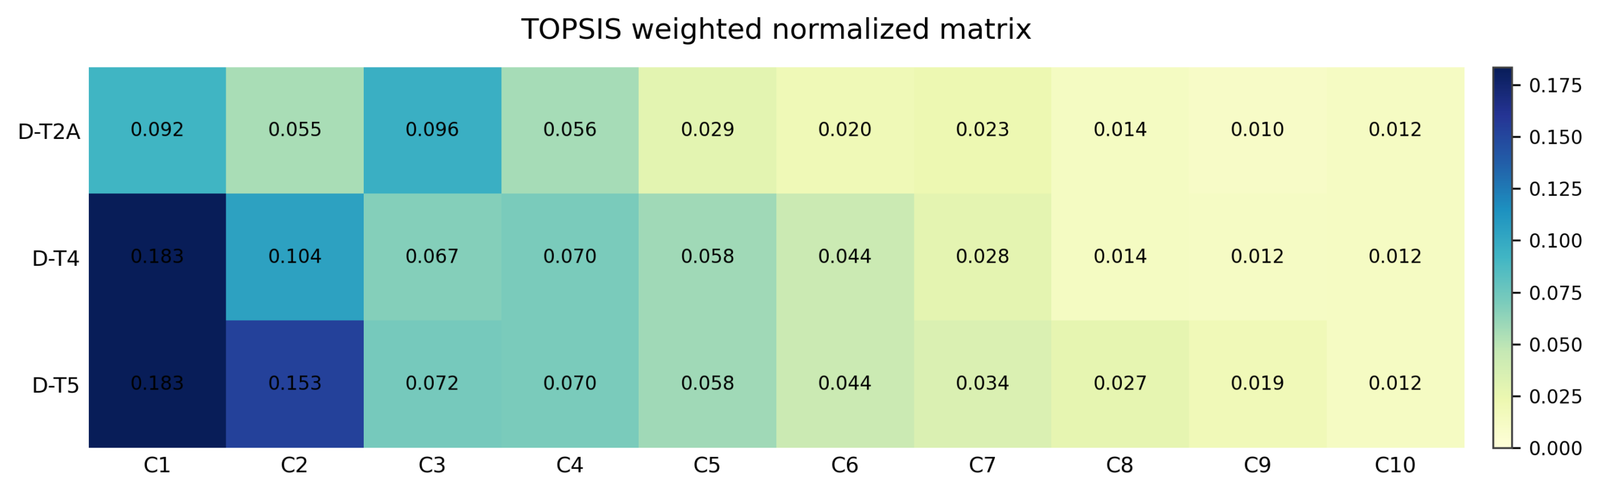
Ideal and negative ideal values are represented in Table 6. In case of the cost criteria, the positive ideal is the smallest weighted value. It is especially important for criterion C9, since D-T2A has the smallest vehicle weight, but D-T5 has the biggest one. Identical charging time makes C10 a nondiscriminating criterion in TOPSIS calculation.
| Criterion | Type | Positive ideal \(v_j^+\) | Negative ideal \(v_j^-\) |
|---|---|---|---|
| C1 | Benefit | 0.183 | 0.092 |
| C2 | Benefit | 0.153 | 0.055 |
| C3 | Benefit | 0.096 | 0.067 |
| C4 | Benefit | 0.070 | 0.056 |
| C5 | Benefit | 0.058 | 0.029 |
| C6 | Benefit | 0.044 | 0.020 |
| C7 | Benefit | 0.034 | 0.023 |
| C8 | Benefit | 0.027 | 0.014 |
| C9 | Cost | 0.010 | 0.019 |
| C10 | Cost | 0.012 | 0.012 |
Closeness coefficients and separation measures are presented in Table 7. Among the designs, D-T5 has the largest closeness coefficient; D-T4 ranks the second; D-T2A ranks the third. D-T5 design does not demonstrate superiority in all criteria compared to others, however, it is closer to the positive ideal solution since it has high load, high productivity, good energy capability and largest distance.
| Alternative | \(S_i^+\) | \(S_i^-\) | \(C_i\) | Rank |
|---|---|---|---|---|
| D-T2A | 0.141 | 0.030 | 0.176 | 3 |
| D-T4 | 0.058 | 0.112 | 0.657 | 2 |
| D-T5 | 0.025 | 0.141 | 0.847 | 1 |
The TOPSIS ranking is therefore
This order indicates that the best spraying UAV for agriculture is the one which retains an excellent aggregate performance in the criteria that are of highest importance with regard to benefits, without having a high cost criteria penalty.
Table 8 presents the normalized matrix for MABAC. The drone with the designation D-T5 has the best score in payload capacity, work efficiency, spray flow, tank capacity, battery capacity, spray width, and transmission range. The drone with the designation D-T2A has the best score in flight time and vehicle weight. The normalized values make the trade-off explicit before the border approximation area is calculated.
| Criterion | D-T2A | D-T4 | D-T5 |
|---|---|---|---|
| C1 | 0.000 | 1.000 | 1.000 |
| C2 | 0.000 | 0.500 | 1.000 |
| C3 | 1.000 | 0.000 | 0.167 |
| C4 | 0.000 | 1.000 | 1.000 |
| C5 | 0.000 | 1.000 | 1.000 |
| C6 | 0.000 | 1.000 | 1.000 |
| C7 | 0.000 | 0.500 | 1.000 |
| C8 | 0.000 | 0.000 | 1.000 |
| C9 | 1.000 | 0.857 | 0.000 |
| C10 | 0.000 | 0.000 | 0.000 |
The weighted MABAC matrix presented in Table 9 shows that the higher the weight of the AHP criteria, the more impact these criteria make on the distance. The superiority of the D-T5 option can be seen in C1 and C2, whereas the D-T2A alternative is dominated by C3 and C9.
| Criterion | D-T2A | D-T4 | D-T5 |
|---|---|---|---|
| C1 | 0.275 | 0.550 | 0.550 |
| C2 | 0.193 | 0.289 | 0.386 |
| C3 | 0.274 | 0.137 | 0.160 |
| C4 | 0.114 | 0.228 | 0.228 |
| C5 | 0.087 | 0.174 | 0.174 |
| C6 | 0.065 | 0.130 | 0.130 |
| C7 | 0.049 | 0.074 | 0.099 |
| C8 | 0.033 | 0.033 | 0.066 |
| C9 | 0.050 | 0.046 | 0.025 |
| C10 | 0.022 | 0.022 | 0.022 |
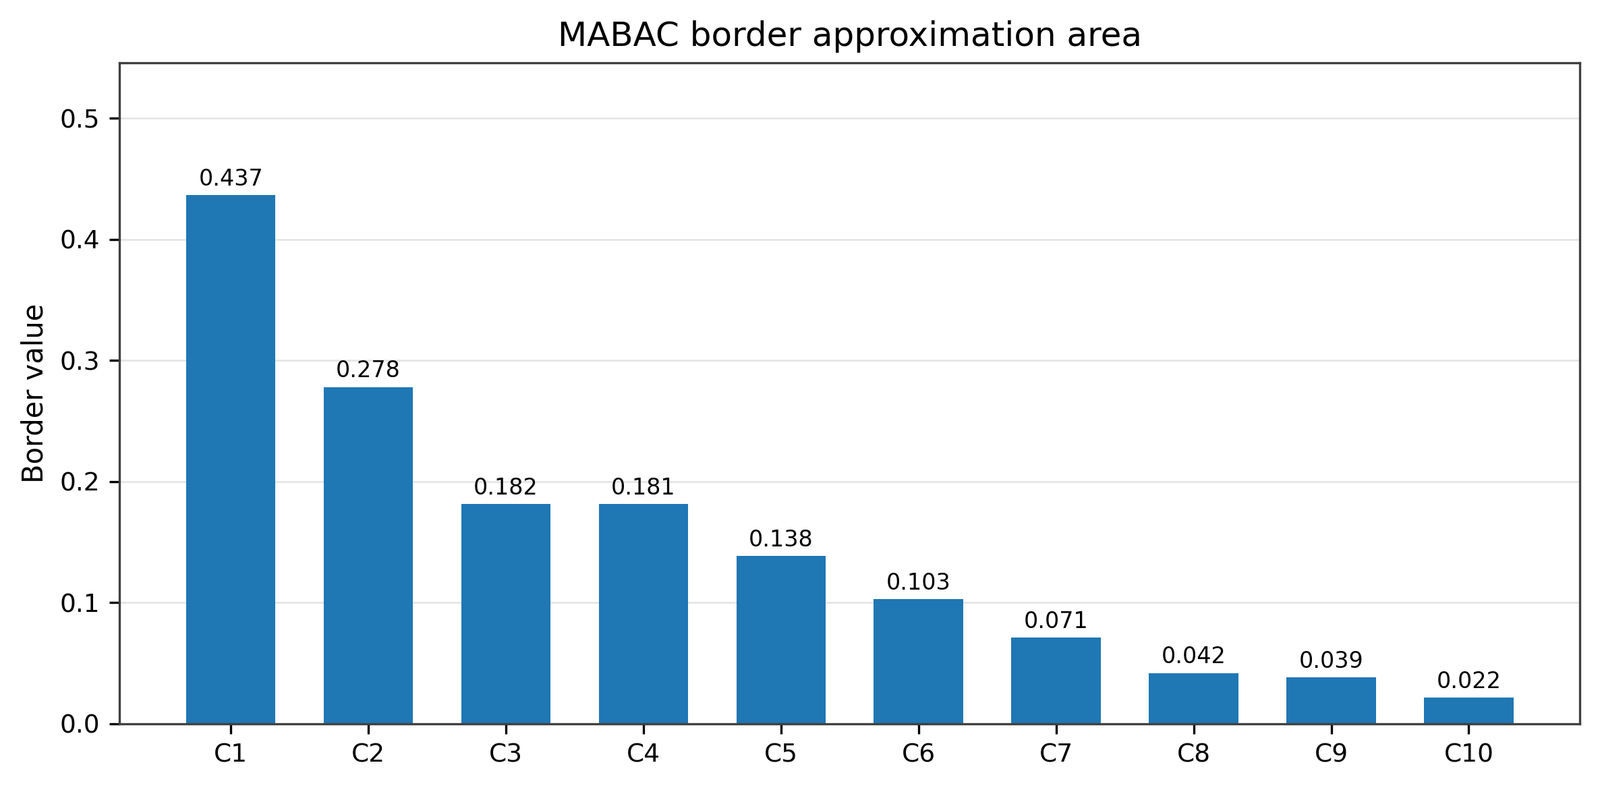
The largest border approximation area in Figure 5 belongs to C1 and C2. Thus, C1 and C2 are the most critical criteria to define the strong and weak alternatives. Criteria that have minor or equal values like the charging time criterion cannot influence the MABAC ordering much.
The values of MABAC scores are presented in Table 10. D-T5 and D-T4 belong to the border approximation area, but D-T2A does not because its score is negative. It means that the poor performance of D-T2A on criteria with large weights makes it a weak alternative.
| Alternative | Score \(S_i\) | Rank |
|---|---|---|
| D-T2A | -0.330 | 3 |
| D-T4 | 0.192 | 2 |
| D-T5 | 0.348 | 1 |
The MABAC ranking is
The consistency of results from MABAC and TOPSIS increases credibility of the decision making because the two approaches apply to criteria in a different way. Namely, TOPSIS uses ideal and negative ideal points as references, whereas MABAC uses border values according to criteria.
ARAS analysis applies the optimal alternative \(A_0\) along with the three UAV alternatives. Table 11 shows the decision matrix in question. The optimal row consists of the best values for all benefit criteria and the worst values for all cost criteria.
| Criterion | \(A_0\) | D-T2A | D-T4 | D-T5 |
|---|---|---|---|---|
| C1 | 20 | 10 | 20 | 20 |
| C2 | 2200 | 800 | 1500 | 2200 |
| C3 | 20 | 20 | 14 | 15 |
| C4 | 2.0 | 1.6 | 2.0 | 2.0 |
| C5 | 20 | 10 | 20 | 20 |
| C6 | 488 | 222 | 488 | 488 |
| C7 | 6 | 4 | 5 | 6 |
| C8 | 2 | 1 | 1 | 2 |
| C9 | 12.5 | 12.5 | 14 | 23 |
| C10 | 1.25 | 1.25 | 1.25 | 1.25 |
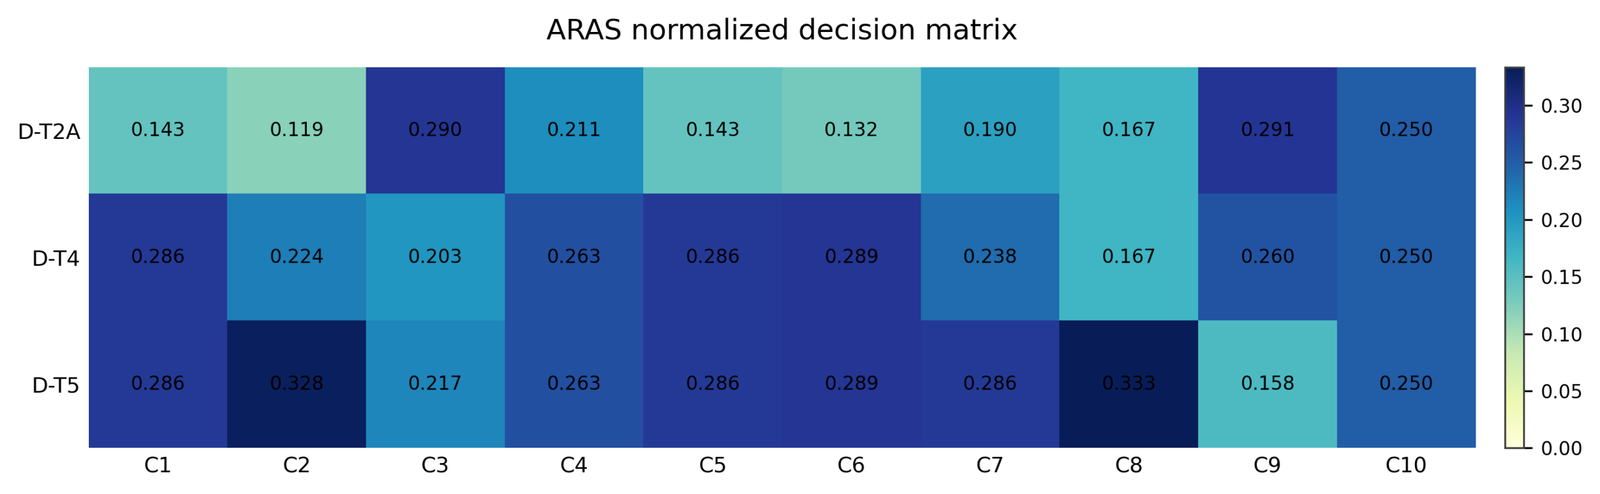
Table 12 contains the normalized ARAS values for the alternatives. Once more, D-T5 performs the best with respect to work efficiency, spray width, and transmission range, and D-T2A has an edge in flight time and vehicle weight. Normalization of ARAS values allows for comparing them with the optimal row directly.
The weighted normalized ARAS scores are presented in Table 13. D-T5 is the best performer in terms of the weighted dominance criteria scores, especially those for C1 and C2, while the cost-based deduction by C9 is not large due to its smaller AHP weight.
| Criterion | Weight | D-T2A | D-T4 | D-T5 |
|---|---|---|---|---|
| C1 | 0.275 | 0.039 | 0.079 | 0.079 |
| C2 | 0.193 | 0.023 | 0.043 | 0.063 |
| C3 | 0.137 | 0.040 | 0.028 | 0.030 |
| C4 | 0.114 | 0.024 | 0.030 | 0.030 |
| C5 | 0.087 | 0.012 | 0.025 | 0.025 |
| C6 | 0.065 | 0.009 | 0.019 | 0.019 |
| C7 | 0.049 | 0.009 | 0.012 | 0.014 |
| C8 | 0.033 | 0.006 | 0.006 | 0.011 |
| C9 | 0.025 | 0.007 | 0.006 | 0.004 |
| C10 | 0.022 | 0.005 | 0.005 | 0.005 |
The results obtained for ARAS optimality and utility can be seen in Table 14. D-T5 scores the highest level of utility, then comes D-T4 and D-T2A. Hence, the result from ARAS shows that D-T5 is the most ideal of all alternatives.
| Alternative | \(S_i\) | \(K_i\) | Rank |
|---|---|---|---|
| D-T2A | 0.175 | 0.596 | 3 |
| D-T4 | 0.252 | 0.861 | 2 |
| D-T5 | 0.280 | 0.955 | 1 |
The ARAS ranking is
Such a concordance between TOPSIS and MABAC is significant since the ARAS method is based on the ideal alternative within the decision matrix instead of using a distance criterion based on the ideal points or border approximation area.
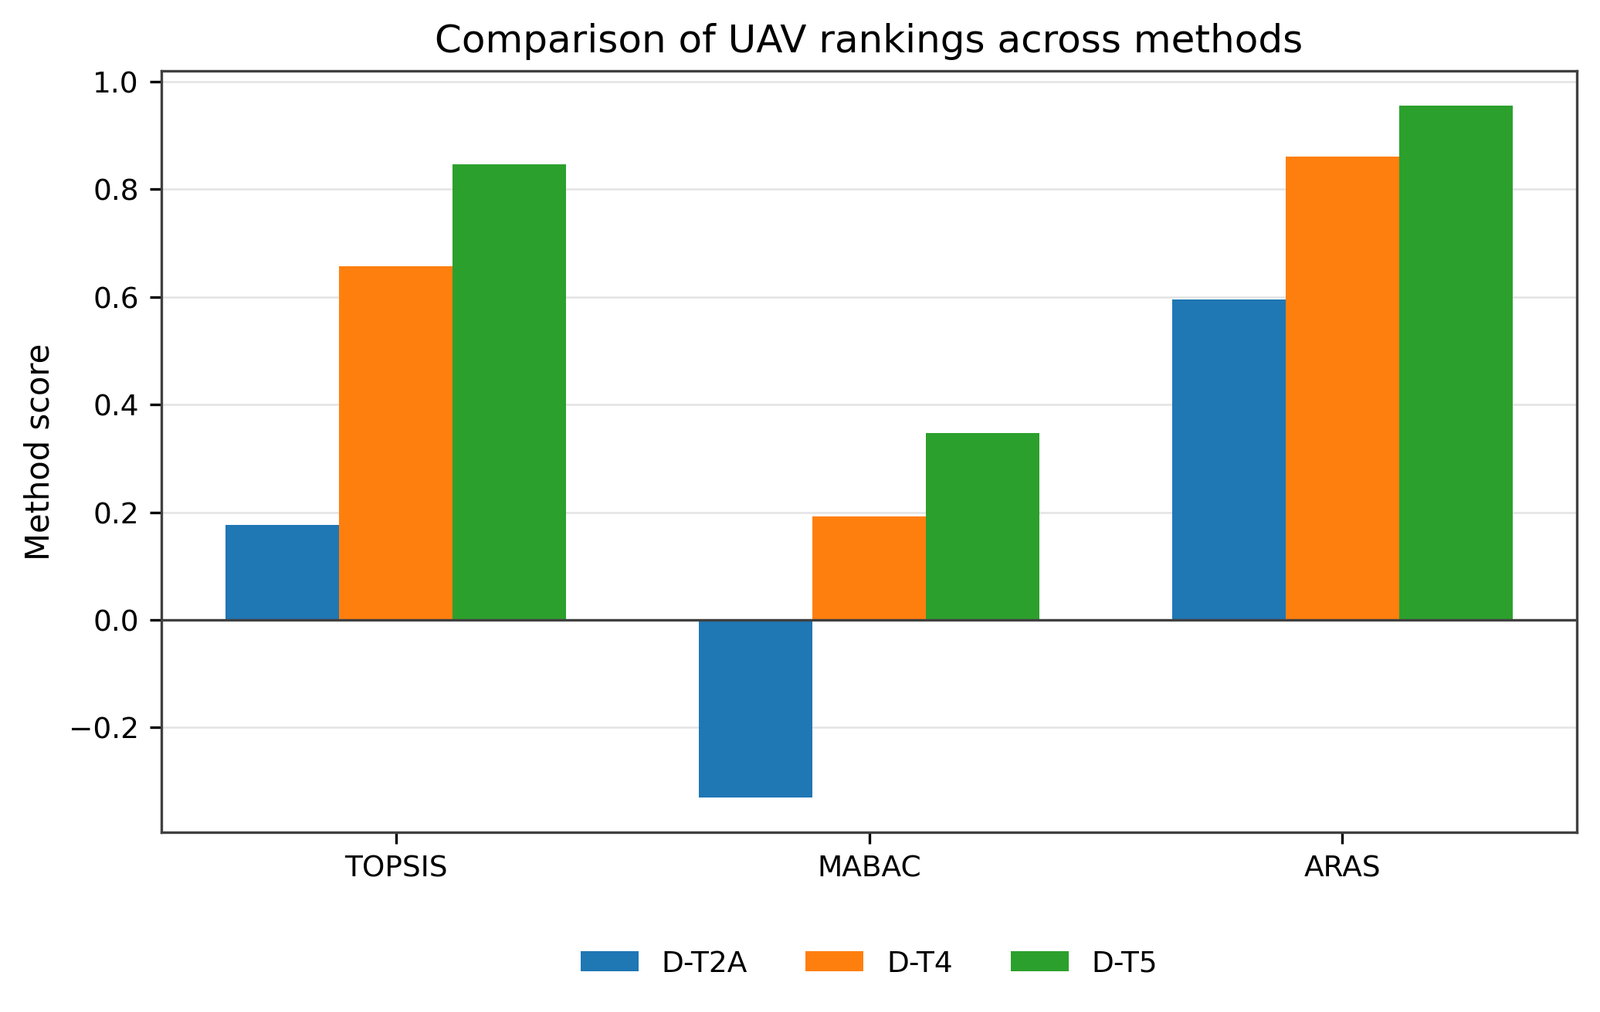
All three ranking methods provide identical ordering, which can be seen in Figure 6 and Table 15. It should not be possible to make any direct comparison between the scores from the different methods due to a difference in their scales. The rank order, however, is directly comparable and is identical for all methods.
| Alternative | TOPSIS \(C_i\) | MABAC \(S_i\) | ARAS \(K_i\) | Overall rank |
|---|---|---|---|---|
| D-T2A | 0.176 | -0.330 | 0.596 | 3 |
| D-T4 | 0.657 | 0.192 | 0.861 | 2 |
| D-T5 | 0.847 | 0.348 | 0.955 | 1 |
D-T5 is considered since it holds all favorable characteristics in terms of productivity along with great capacity and range. D-T4 could be chosen as an alternative solution since it holds equal payload, tank capacity, and battery capacity but is inferior to D-T5 with regard to work efficiency and range. D-T2A can be regarded as the last one among the solutions since it is characterized by low payload, tank capacity, battery capacity, and work efficiency. It is positive in terms of flight time and vehicle weight.
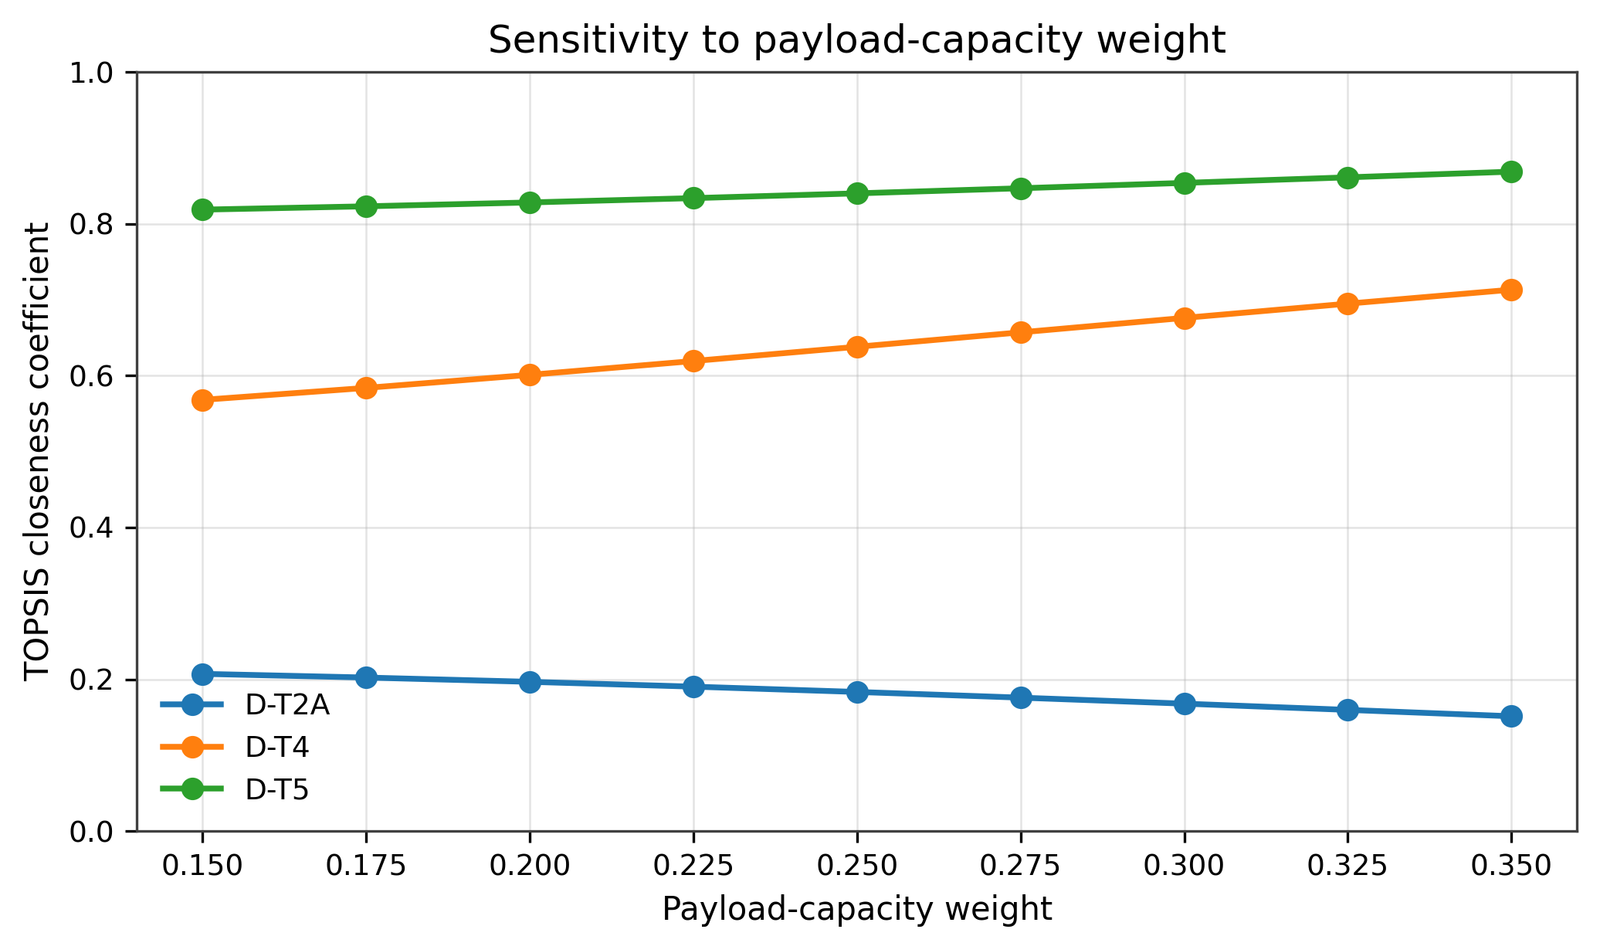
Figures 7 and 8 show the results of sensitivity analysis. If the weight of payload capacity varies from 0.15 to 0.35, then D-T5 stays first, D-T4 stays second, and D-T2A stays third. The closeness coefficients change gradually, but no rank reversal occurs.
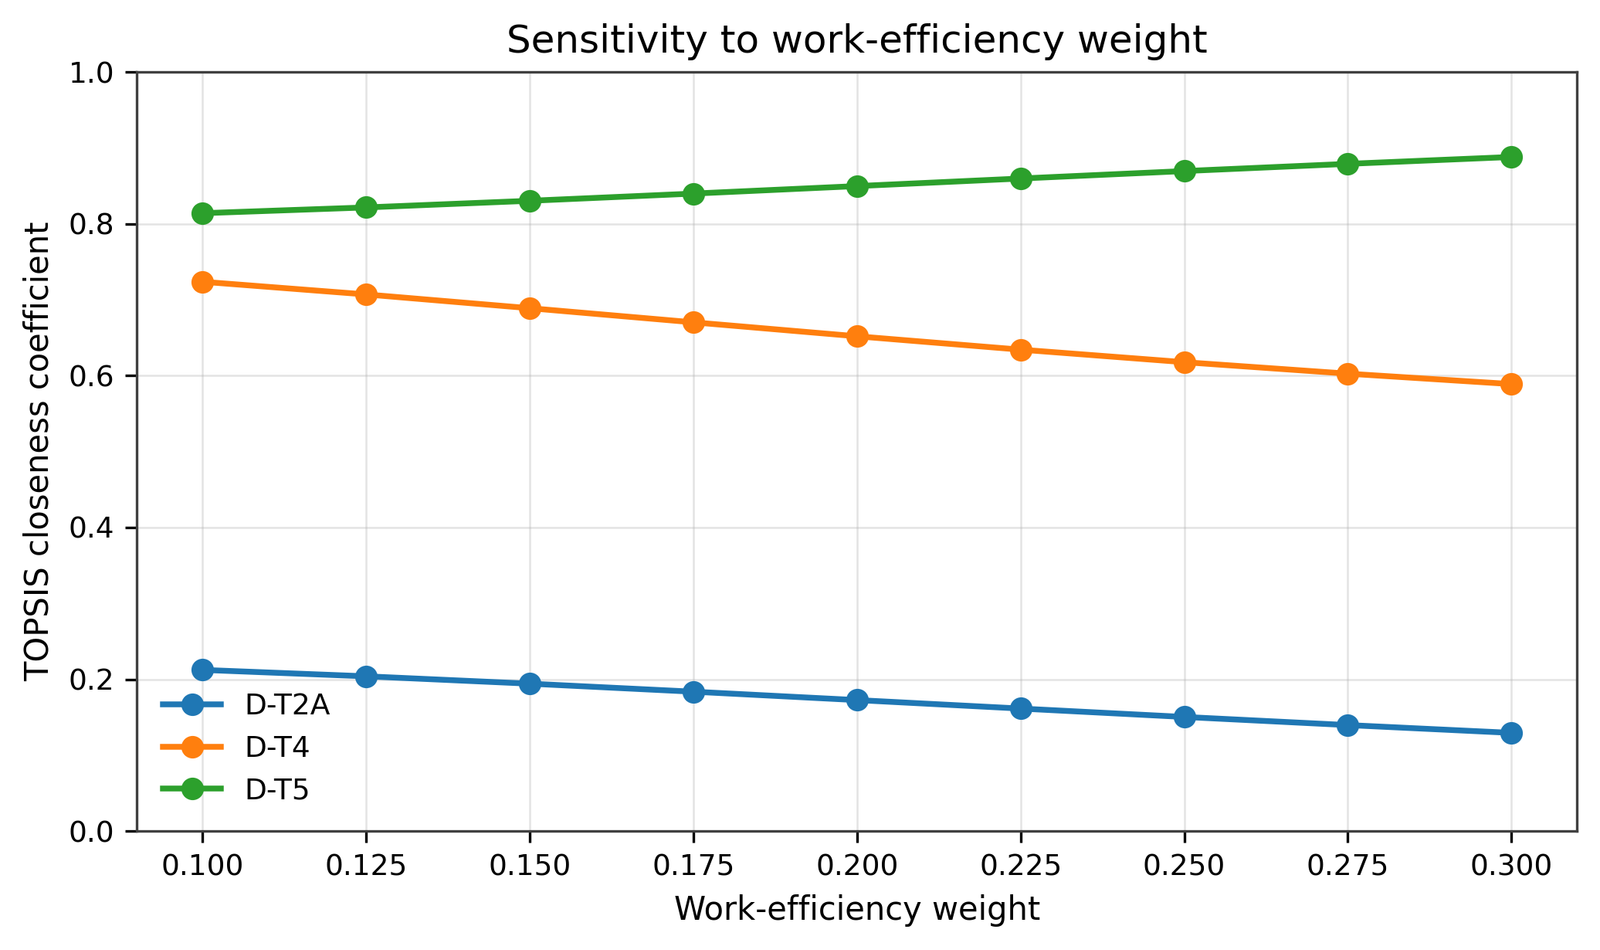
Another sensitivity analysis on work-efficiency weight from 0.10 to 0.30 is conducted, with results displayed in Figure 8. D-T5 remains the best solution throughout the whole range. This is meaningful in practice since work efficiency is an extremely critical criterion in spraying process; it determines the area of sprayed zone per unit of time.
The lack of rank reversals implies that the decision is robust against any plausible changes of the two highest weights. The overall consideration of all ranking techniques and sensitivity analysis leads to the same practical conclusion: D-T5 is the most powerful spraying drone of the considered alternatives, while D-T4 is the second best, and D-T2A is a weaker choice for such tasks.
This research attempted to find out if a stable and transparent ranking of agricultural spraying UAVs could be achieved in consideration of multiple criteria. The answer is positive. AHP generated the criterion weight vector consistently, and TOPSIS, MABAC, and ARAS produced the same ranking order: first place was taken by D-T5, the second – by D-T4, and the third – by D-T2A.
From AHP we know that the payload capacity, work efficiency, flight time, and spray-flow rate criteria are the most influential. These criteria are the main ones in agricultural spraying because they define the carrying ability, productivity, continuity of operations, and capability of delivering liquid. Tank capacity, battery capacity, spray width, and transmission range are also essential for the final ranking, and vehicle weight and charging time have less influence on it within the current decision matrix.
The convergence of three separate ranking techniques shows that the superiority of D-T5 is not a consequence of applying one particular ranking technique. The best UAV is D-T5 because it has maximum values of payload and tank capacities, work efficiency, spray width, and transmission range. The UAV D-T4 offers the best balance, while D-T2A is limited by low capacity and efficiency despite its advantages in flight time and vehicle weight.
The results of sensitivity analysis show that the final ranking order does not change under variation of payload capacity and work efficiency weights. It is quite significant since these criteria take a dominating place in the weight vector and are going to be differently weighted by various potential users. Hence, the findings may serve as a reliable basis for purchasing UAVs, forming a fleet, and conducting agricultural spraying.
The major innovation of this research is the development of the consistent decision-making procedure combining AHP weights with rankings of three alternative techniques and providing a ranking stability check via sensitivity analysis. Further research can include additional criteria such as acquisition cost, maintenance cost, field-testing reliability, environmental impact, operator safety, spare parts availability, and uncertain preference information.