
Industrial effluent is wastewater generated during processing in industries such as mining, electroplating, leather tanning, pigments and dyes, ceramics, breweries, food processing, oil exploration and pharmaceuticals [1–7]. Large amount of water is required by breweries in the processes of brewing, washing, cooling, bottling and cleaning purposes and the wastewater contains suspended solids, organic load, dissolved salts and metal elements such as chromium, cadmium, copper, lead, nickel and iron [8,9]. The release of such effluents into water bodies may affect water quality through changing the pH level, reducing light penetration, disrupting dissolved oxygen balance and creating hazards because heavy metals are not biodegradable and tend to bioaccumulate in both organisms and soils [10].
Metal pollution in the environment has drawn much concern because metal-bearing effluents could pose danger to the ecosystem and human health even at low concentrations. The conventional technologies in the treatment of wastewater containing toxic metal ions are chemical precipitation, flotation, ion exchange and membrane filtration [11–14]. Despite their efficiencies, high operating costs, production of secondary sludge, regeneration difficulties and membrane fouling are some of the constraints associated with these technologies. Adsorption has continued to attract much interest because of its simplicity of operation, suitability to batch and continuous process as well as compatibility with inexpensive sorbents derived from biomass [15,16].
Activated carbon has remained among the most popular adsorbent for the removal of metal ions and organic compounds due to its porous structure, surface functional groups and relatively high affinity to dissolved contaminants. Biomass materials including coconut shells, coconut coir, rice husks, orange peels, peanut husks, sawdust, prickly pear seed cake and many others have been transformed into activated carbon for wastewater treatment [1,2,15–19]. The process not only removes the pollutants but also finds value for the use of the agro-residues. Agro-wastes of African pear (Dacryodes edulis) seeds have been reported in parts of Nigeria, although its transformation into activated carbon for chromium removal from brewery effluent has not been extensively studied.
In the present study, the use of activated carbon obtained from the local agro-waste of African pear seeds is proposed for the removal of Cr2+ from brewery effluent. The novelty of this research involves the combination of the preparation of African pear seed activated carbon (APSAC), physicochemical characterization and the determination of optimum condition, equilibrium isotherm and kinetics under the same experimental conditions. The aims of the research were the preparation and characterization of APSAC, the assessment of the effect of contact time, initial Cr2+ concentration and adsorbent dosage on chromium removal and adsorption capacity, the identification of the most suitable isotherm for the equilibrium data and the elucidation of the rate controlling mechanism.
Seeds of the African pear tree that served as the activated-carbon precursor were sourced from Ikot Akpaden, Mkpat Enin Local Government Area, Akwa Ibom State, Nigeria. Sulphuric acid (\(\mathrm{H_2SO_4}\)) was purchased from a chemical vendor in Uyo, Akwa Ibom State, Nigeria. Brewery effluent was acquired from Champions Breweries PLC, Uyo, Akwa Ibom State, Nigeria. Distilled water was used in cleaning, preparation and neutralization processes.
The African pear seeds were cleaned several times with distilled water to eliminate any adhering impurities and allowed to dry under the sun for 3 days. The dried seeds were pulverized to decrease particle size and oven-dried at 100 °C for 4 h. The precursor was carbonized in the muffle furnace (GALLENKAMP 220/240) at 600 °C for 2 h. The carbonized material was soaked in 40% concentrated \(\mathrm{H_2SO_4}\) for 24 h and activated in the muffle furnace at 500 °C for 4 h. The activated product was washed with distilled water till a neutral pH of 7.0 was attained and was dried at 100 °C for 4 h. It was then sieved to obtain particle size of 250 µm. The sieved product was kept in an airtight container before use.
The physicochemical characteristics of APSAC were determined by standard ASTM procedure [20]. The determination of moisture content, volatile matter, ash content, bulk density and pH were done based on ASTM D2867, ASTM D2865, ASTM D2866, ASTM D2854-96 and ASTM D3838-80 standards respectively. Fixed carbon was evaluated from mass balance after determination of moisture, volatile matter and ash contents.
Surface morphology of the adsorbent before and after adsorption were analyzed by means of scanning electron microscopy (SEM; JEOL JSM-6300F). Identification of surface functional groups were done using FTIR (Perkin-Elmer Spectrum 2000) in the mid-infrared region. The procedures for characterizing the adsorbent followed those described in literature [20,21].
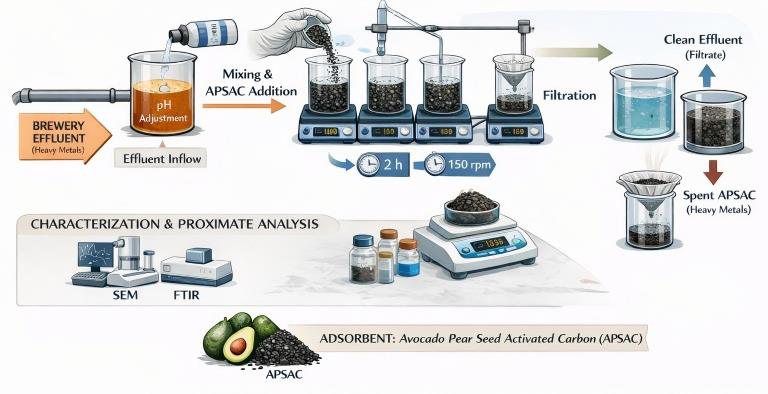
Batch studies were conducted to study the effect of contact time, initial chromium concentration and adsorbent dose on chromium adsorption on APSAC. In each experiment, 200 mL of chromium containing brewery effluent or prepared metal ion solution was taken in a 250 mL beaker and a certain quantity of APSAC was introduced. The beaker was agitated on an orbital shaker (Rotamax 120, Heidolph) at 150 rpm and 25 °C for a specific contact time. The suspension was filtered with Whatman No. 14 filter paper and the chromium residual concentrations were measured using atomic absorption spectroscopy (Unicam Thermo/Solar System 2009 model). The chromium equilibrium uptake capacity, uptake rate at any time \(t\) and percentage removal of chromium were calculated according to Equations (1)–(3).
In the above equations, \(C_o\) represents the initial chromium concentration (mg L−1), \(C_e\) represents the equilibrium concentration (mg L−1), \(C_t\) is the concentration at time \(t\) (mg L−1), \(V\) is the volume of the solution (L), and \(M\) is the mass of the adsorbent (g). The procedure followed in the preparation of adsorbents, adsorption process, filtration, and analytical measurement is illustrated in Fig. 1.
The adsorption tests have been designed using central composite design in Design-Expert software version 10 to study the effect of three factors on adsorption capacity and the removal of chromium. Factors such as contact time (\(A\)), initial chromium concentration (\(B\)), and adsorbent dosage (\(C\)) have been varied within the ranges specified in Table 1. Table 2 shows the designed experimental matrix and corresponding responses. Response surface method has been employed to explain the effect of factors on the adsorption response and the quadratic model was analyzed through ANOVA.
| Factor | Variable | Type | Minimum | Maximum |
|---|---|---|---|---|
| \(A\) | Contact time (min) | Numeric | 15 | 75 |
| \(B\) | Initial concentration (mg L−1) | Numeric | 0.005 | 0.025 |
| \(C\) | Adsorbent dosage (g) | Numeric | 0.5 | 2.5 |
| Run | Factor \(A\) Contact time (min) | Factor \(B\) Initial concentration (mg L−1) | Factor \(C\) Adsorbent dosage (g) | Adsorption capacity (mg g−1) | Cr2+ removal (%) |
|---|---|---|---|---|---|
| 1 | 30 | 0.020 | 2.0 | 0.001700 | 85.0000 |
| 2 | 60 | 0.010 | 2.0 | 0.000200 | 20.0000 |
| 3 | 30 | 0.020 | 1.0 | 0.003800 | 95.0000 |
| 4 | 45 | 0.015 | 0.5 | 0.004800 | 80.0000 |
| 5 | 30 | 0.010 | 1.0 | 0.001000 | 50.0000 |
| 6 | 15 | 0.015 | 1.5 | 0.001467 | 73.3333 |
| 7 | 75 | 0.015 | 1.5 | 0.001867 | 93.3333 |
| 8 | 45 | 0.005 | 1.5 | 0.000533 | 80.0000 |
| 9 | 45 | 0.015 | 2.5 | 0.001120 | 93.3333 |
| 10 | 60 | 0.020 | 2.0 | 0.001700 | 85.0000 |
| 11 | 30 | 0.010 | 2.0 | 0.000500 | 50.0000 |
| 12 | 45 | 0.025 | 1.5 | 0.003200 | 96.0000 |
| 13 | 45 | 0.015 | 1.5 | 0.000533 | 26.6667 |
| 14 | 60 | 0.010 | 1.0 | 0.001400 | 70.0000 |
| 15 | 60 | 0.020 | 1.0 | 0.003000 | 75.0000 |
Proximate properties of APSAC are shown in Table 3. The sample had a low percentage of moisture (3.28%) and a low ash percentage (1.28%), suggesting that drying, carbonization and activation processes produced a carbon-enriched adsorbent having little inorganic ash. Low moisture content is preferred since the water filling pores would reduce the adsorption capacity. Ash can be detrimental due to pore blockage, reduction in concentration of active carbon and decrease in strength and activity of activated carbons [20,21]. Volatile matter of 1.04% is an indication of elimination of most of the thermally unstable compounds, resulting in the production of relatively stable carbon matrix. Density of 0.332 g cm−3 indicates that the sample could settle well and contact the water system. The close to neutral pH (7.02) is an indicator of minimal disturbance in pH of the system during treatment process. The fixed carbon content of 86.0% confirms that APSAC possesses a carbon-rich structure suitable for contaminant uptake.
| Property | APSAC |
|---|---|
| Moisture content (%) | 3.28 |
| Volatile matter (%) | 1.04 |
| Ash content (%) | 1.28 |
| pH | 7.02 |
| Bulk density (g cm−3) | 0.332 |
| Fixed carbon (%) | 86.0 |
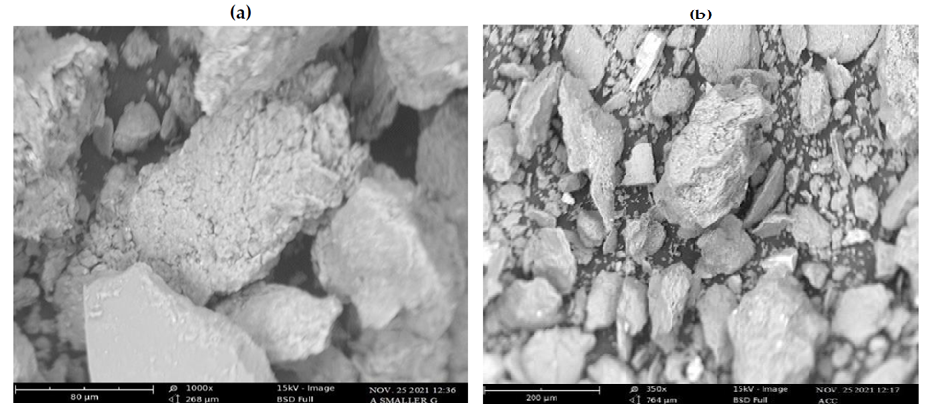
The SEM images prior to and post-adsorption are presented in Figure 2. It can be observed that the surface of raw APSAC in Figure 2(a) has an uneven surface topography with irregular particles, rough surfaces, and cavities as a result of the acid activation process. These characteristics of the surface are favorable since they provide more surface areas for the chromium adsorption. In Figure 2(b), it can be seen that the surface after adsorption has relatively more coverage, and there are cavities which are partially occupied. This is a morphological modification that confirms the uptake of chromium on APSAC and is in agreement with the pore filling, surface complexing, and deposition of adsorbed species observed in biomass-based activated carbons [17–19,22].
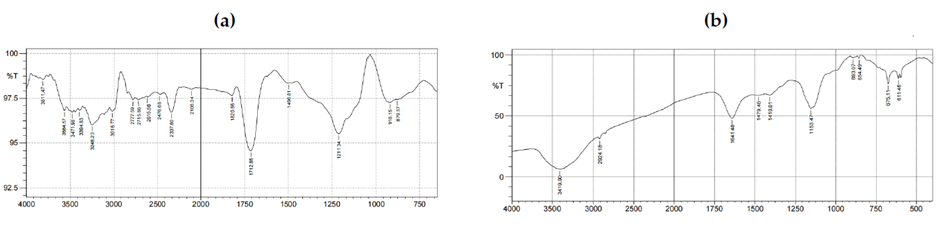
The FTIR spectra given in Figure 3 along with the assignment data given in Table 4 reveal that APSAC has oxygen-containing and carbon-containing functional groups that can react with chromium species. Prior to adsorption, the broad band ranging from 3564.57 to 3248.23 cm−1 suggests the presence of hydrogen-bonded hydroxyl groups, and the peak at 1712.85 cm−1 is due to stretching vibration of carbonyl groups of carboxylic acid group. The peaks at 1211.34 and 918.15 cm−1 are suggestive of C-O/C-O-C and O-H out-of-plane vibrations respectively, indicating the presence of oxygen-containing surface sites.
Upon adsorption, the spectrum shows a prominent OH group at 3419.90 cm-1, a peak at 1641.48 cm-1 that can be either due to C=C stretching or N-H bending vibration and peaks at 675.11-611.45 cm-1 corresponding to inorganic or metal-oxygen vibrations. The reduction or absence of some peaks before and after adsorption, specifically carboxyl or carbonyl groups, is an indication that oxygenated sites have taken part in the binding of chromium. These spectral changes support a multi-site adsorption process involving surface functional groups rather than simple physical retention alone [23,24].
| Functional group assignment | Before adsorption (cm−1) | After adsorption (cm−1) |
|---|---|---|
| O–H stretching of alcohol groups | 3811.47 | – |
| Hydrogen-bonded O–H stretching of alcohol, carboxylic acid, or phenol groups | 3564.57–3248.23 | 3419.90 |
| =C–H stretching of aromatic groups | 3016.77 | – |
| Asymmetric C–H stretching of aliphatic CH\textsubscript{2}/CH\textsubscript{3} groups | – | 2924.18 |
| Asymmetric C–H stretching of aldehyde groups | 2777.59–2715.86 | – |
| O–H stretching of carboxylic acid groups | 2615.56 | – |
| S–H stretching, P–H stretching, or carboxylic-acid O–H vibration | 2476.68 | – |
| C\(\equiv\)C stretching of alkyne groups | 2106.34 | – |
| C=O stretching of aryl carbonate groups | 1820.86 | – |
| C=O stretching of carboxylic acid groups | 1712.85 | – |
| C=C stretching of alkene groups or N–H bending of primary amine/amide groups | – | 1641.48 |
| C=C stretching of aromatic rings or N–H bending | 1498.81 | – |
| C–H bending of aliphatic methylene groups | – | 1479.45 |
| C–H bending or O–H in-plane bending of alcohol/carboxylate groups | – | 1410.01 |
| C–O–C stretching of ethers/esters or C–O stretching of carboxylic acid groups | 1211.34 | 1153.47 |
| O–H out-of-plane bending of carboxylic acid dimers | 918.15 | – |
| C–H out-of-plane bending of substituted aromatic rings | 879.57 | 893.07–854.49 |
| C–X or metal–oxide stretching of inorganic components | – | 675.11–611.45 |
It can be noted from the experimental results shown in Table 2 that APSAC efficiency depended greatly on the interaction between the contact time, the concentration of the ions, and the adsorbent dosage. The highest chromium removal percentage was 96% at 45 min, 0.025 mg L−1, and 1.5 g APSAC, while the highest adsorption capacity was 0.0048 mg g−1 at 45 min, 0.015 mg L−1, and 0.5 g APSAC. It is necessary to mention the difference between the two parameters as the increase in percentage of chromium removed means more adsorption sites available. The adsorption capacity, however, is dependent on the dosage, as the sites not being used reduce the amount of chromium adsorbed per unit mass of the sorbent. Therefore, in the optimal case one should choose the design depending on the goal of the experiment: polishing of the water or utilization of the sorbent.
ANOVA table of the adsorption capacity response is shown in Table 5. It can be seen that the quadratic model of the response is significant (\(F=13.94\), \(p=0.0049\)). This implies that the chosen factors accounted for the variation observed in the experiment. The high value of the coefficient of determination (\(R^2=0.9617\)) was supported by the adjusted \(R^2\) value of 0.8927, thus demonstrating that the selected model still retains its explanatory power with respect to the number of terms included in the model. The smaller predicted \(R^2\) of 0.6690 is expected in the case of small design experiments within limited concentration range. The adequate precision of 11.8203 was higher than 4 (Table 6).
| Source | Sum of squares | df | Mean square | \(F\)-value | \(p\)-value | Significance |
|---|---|---|---|---|---|---|
| Model | 2.43E-05 | 9 | 2.70E-06 | 13.94 | 0.0049 | Significant |
| \(A\) – Contact time | 3.81E-07 | 1 | 3.81E-07 | 1.97 | 0.2193 | – |
| \(B\) – Initial concentration | 1.74E-08 | 1 | 1.74E-08 | 0.0897 | 0.7767 | – |
| \(C\) – Adsorbent dosage | 2.71E-06 | 1 | 2.71E-06 | 13.99 | 0.0134 | Significant |
| \(AB\) | 1.01E-07 | 1 | 1.01E-07 | 0.5231 | 0.5019 | – |
| \(AC\) | 1.25E-09 | 1 | 1.25E-09 | 0.0065 | 0.9391 | – |
| \(BC\) | 3.61E-07 | 1 | 3.61E-07 | 1.87 | 0.2301 | – |
| \(A^2\) | 9.56E-07 | 1 | 9.56E-07 | 4.94 | 0.0769 | – |
| \(B^2\) | 1.31E-06 | 1 | 1.31E-06 | 6.76 | 0.0482 | Significant |
| \(C^2\) | 4.22E-06 | 1 | 4.22E-06 | 21.80 | 0.0055 | Significant |
| Residual | 9.68E-07 | 5 | 1.94E-07 | – | – | – |
| Corrected total | 2.53E-05 | 14 | – | – | – | – |
| Metric | Value |
|---|---|
| Standard deviation | 0.0004 |
| Mean | 0.0018 |
| Coefficient of variation (%) | 24.6 |
| \(R^2\) | 0.9617 |
| Adjusted \(R^2\) | 0.8927 |
| Predicted \(R^2\) | 0.6690 |
| Adequate precision | 11.8203 |
The significant factors in Table 5 were the adsorbent dosage (\(C\)), the quadratic concentration factor (\(B^2\)), and the quadratic dosage factor (\(C^2\)). Such result reveals that the adsorption capacity was not dependent on a simple linear increase in sorbent weight. Rather, the curvature factors reveal a non-linear relationship between available binding sites, driving force of the solute, and adsorbent usage. The quadratic model for adsorption capacity using coded factors is given in Eq. (4). The factors \(A\), \(B\), and \(C\) in the equation refer to the coded contact time, initial chromium concentration, and adsorbent dosage, respectively.
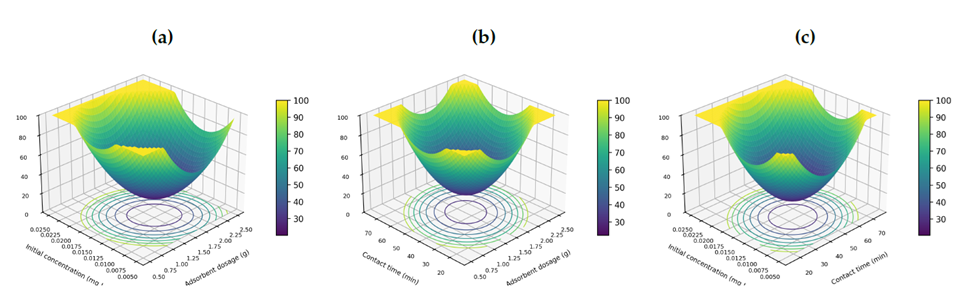
The response surfaces presented in Figure 4 give information on the joint effect of operating parameters on chromium removal. It was noted that an increase in the amount of adsorbent generally increased the removal rate since the use of more APSAC meant having more adsorption sites. However, from the response surfaces, it is clear that the effect of increasing dosage was not consistent, especially with different initial concentrations of chromium ions. In the case of high initial concentration, the presence of strong driving force meant better contact and, hence, adsorption; however, there was increased competition among adsorbing species. Thus, the optimum range was in the intermediate-to-high dosage level coupled with enough contact time.
Contact time changed the above behavior by increasing the surface coverage. Removal increased with contact time approaching the middle-to-high range, beyond which the response surface started flattening due to the process approaching equilibrium. The interactions between contact time and initial concentration demonstrate that rapid removal could be obtained when the initial concentration was low; otherwise, adequate time was required for diffusion through the boundary layer and adsorption onto the active sites. The findings are consistent with the statistical response and kinetics results in which the influence of external mass transfer is observed [25,26].
From the adsorption capacity surfaces presented in Figure 5, a reaction trend is observed to be different from percentage removal due to capacity being defined per mass of adsorbent. When contact time is constant, increase in the initial concentration promoted the adsorption capacity through the increased concentration gradient between the solution and the APSAC surface. However, increased adsorbent dosage caused reduction in mass-based adsorption capacity in some regions since the same amount of chromium was spread on a higher mass of adsorbent. This explains why the highest percentage removal and highest adsorption capacity occurred at different experimental conditions.
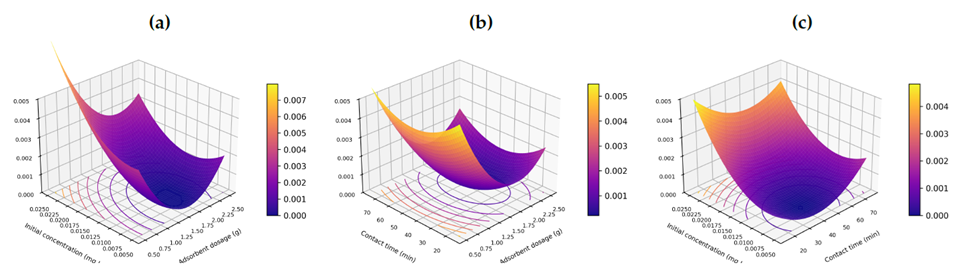
As seen from the capacity vs. dosage/concentration and capacity vs. contact-time plots, the effect of dose/concentration was significantly stronger than that of time in the analyzed region. This result implies that quite a significant amount of chromium had been accumulated by the material before the maximum time of contact had elapsed, whereas further shaking would lead to an improvement in the completeness of coverage of the surface rather than a linear growth in mass-normalized capacity. This information is important when choosing the optimal conditions for application of the sorbent.
Adsorption isotherms obtained from the equilibrium state were fitted using Langmuir, Freundlich, Sips and Redlich-Peterson isotherm models (Table 7). According to the Langmuir model, \(q_m=0.2623\) mg g−1, \(b=2.4367\) L mg−1 and \(R^2=0.9106\). Thus, there was a moderately good agreement between the experimental data and the assumption of monolayer adsorption on the homogeneous surface. As per the Freundlich model, \(R^2=0.9165\) and the intensity parameter was equal to \(n=0.9035\). It can be concluded that the adsorption surface was not a uniform heterogeneous surface as it could be expected for this adsorption mechanism [27,28].
Sips model was found to give the best fits with the parameters \(R^2=0.9849\), \(q_{ms}=0.00697\) mg g−1, \(K_s=1.124\times10^7\), and \(\beta=3.0859\). Since Sips model is characterized by the combination of Langmuir-like saturation with Freundlich-like heterogeneity, the good fit obtained can be interpreted to mean that there are binding sites on APSAC that differ in their affinity for Cr(VI). This result supports the SEM results showing that the APSAC morphology is heterogeneous and the FTIR results indicating that more than one type of oxygenated group takes part in binding Cr(VI).
| Isotherm model | Non-linear equation | Parameter | Result |
|---|---|---|---|
| Langmuir | \(q_e=\dfrac{q_m b C_e}{1+bC_e}\) | \(q_m\) \(b\) \(R^2\) | 0.262286408 2.436677744 0.910552 |
| Freundlich | \(q_e=k_f C_e^{1/n}\) | \(k_f\) \(n\) \(R^2\) | 1.069607895 0.903538479 0.916494 |
| Sips | \(q_e=\dfrac{q_{ms}K_sC_e^{\beta}}{1+K_sC_e^{\beta}}\) | \(q_{ms}\) \(K_s\) \(\beta\) \(R^2\) | 0.006970026 11241417.68 3.085929447 0.984892 |
| Redlich–Peterson | \(q_e=\dfrac{AC_e}{1+BC_e^{\beta}}\) | \(A\) \(B\) \(\beta\) \(R^2\) | 0.629934119 1.253338793 1.571175204 0.911054 |
Parameters describing the kinetics of chromium sorption by APSAC have been presented in Table 8. The pseudo first order equation provided slightly better fitting to the data compared to the pseudo second order equation (\(R^2=0.9427\) vs \(R^2=0.9421\)). Nevertheless, this slight difference indicates that surface adsorption was one of the important steps in the chromium sorption process. Nevertheless, similarity in these two equations shows that the process could not be described in terms of either physical adsorption or chemisorption only [29,30].
| Kinetic model | Non-linear equation | Parameter | Result |
|---|---|---|---|
| Pseudo-first-order | \(q_t=q_e\left(1-e^{-K_1t}\right)\) | \(K_1\) \(q_e\) \(R^2\) | \(1.46265\times10^{-5}\) 5.148106443 0.94268 |
| Pseudo-second-order | \(\dfrac{dq_t}{dt}=K_2(q_e-q_t)^2\) | \(K_2\) \(q_e\) \(R^2\) | \(6.54372\times10^{-5}\) 1.07455087 0.94207 |
| Intra-particle diffusion | \(q_t=K_p\sqrt{t}+C\) | \(K_{ip}\) \(C\) \(R^2\) | 0.000534207 0 0.762849 |
| Boyd | \(F=1-\dfrac{6}{\pi^2}\displaystyle\sum_{n=1}^{\infty}\left(\dfrac{1}{n^2}\right)\exp(-n^2Bt)\) | \(q_e\) \(R^2\) | 5.1481 0.9748 |
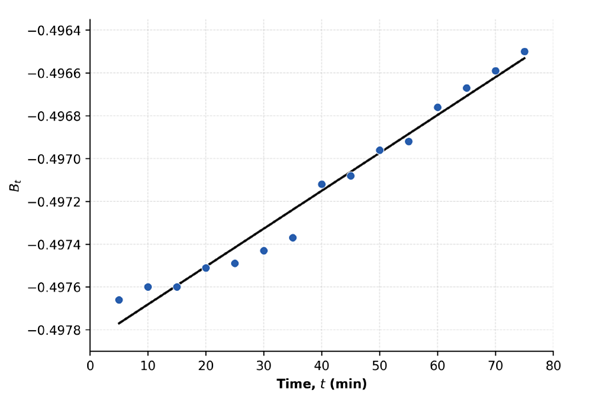
The intra-particle diffusion model resulted in an \(R^2\) value of 0.7628, which shows that pore diffusion was not entirely responsible for the rate of adsorption. The Boyd model offered the best fit (\(R^2=0.9748\)), while the graph obtained for the Boyd model in Figure 6 does not start from zero. This means that film diffusion played a major role in the adsorption of chromium ions [31]. Therefore, the process scale-up must account for mixing intensity, contact effectiveness, and adsorbent dispersion, apart from equilibrium capacity.
The current research attempted to find out whether African pear seed activated carbon could be used as an efficient adsorbent for the removal of chromium from brewery effluent. In addition, it sought to establish the factors and mechanisms behind the adsorption activity of the material. The results of this study are affirmative in answering the above-stated objective. APSAC obtained through acid assisted activation showed very low moisture content, ash content, and very high fixed carbon content, as well as a rough and porous nature and oxygen-containing functional groups on the surface for chromium binding.
The response surface method gave the information that removal efficiency and adsorption capacity had to be considered together since a high percentage of removal does not guarantee maximum adsorption capacity. The significant adsorption-capacity model (\(R^2=0.9617\)) indicated that dosage and non-linear factor effects were important for obtaining an appropriate operating range. Equilibrium study showed that the Sips isotherm model was the most representative in describing the adsorption process, which indicated the heterogeneous surface binding. Kinetic and Boyd methods revealed the surface and film diffusion mechanisms to be responsible for the chromium adsorption. The results have proved APSAC to be a potential adsorbent for chromium removal in beer wastewater and have provided a foundation for future research on its regeneration and operational performances.
| APSAC | African pear seed activated carbon |
| ANOVA | Analysis of variance |
| AAS | Atomic absorption spectroscopy |
| ASTM | American Society for Testing and Materials |
| CCD | Central composite design |
| DOE | Design of experiment |
| FTIR | Fourier-transform infrared spectroscopy |
| PFO | Pseudo-first-order |
| PSO | Pseudo-second-order |
| RSM | Response surface methodology |
| SEM | Scanning electron microscopy |
| TDS | Total dissolved solids |